| Red | Green | Blue | |
| z | 17.64 | ||
| znorm | Inf | ||
| sky | -Inf | -Inf | -Inf |
| S/N | 20.5 | 35.2 | 40.7 |
| S/N(c) | 0.0 | 0.0 | 0.0 |
| SN(E/C) |
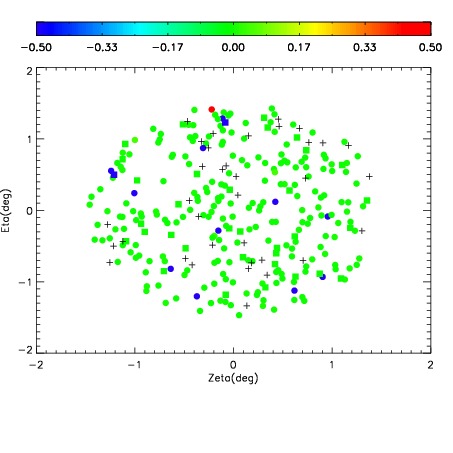
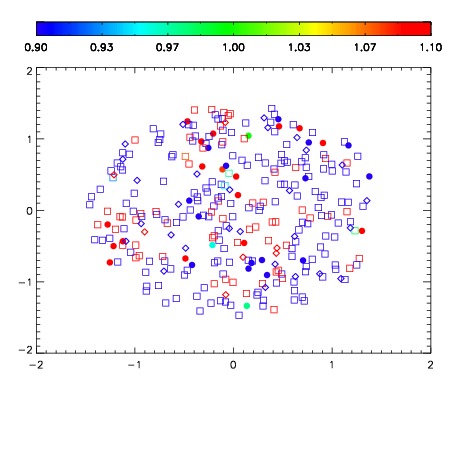
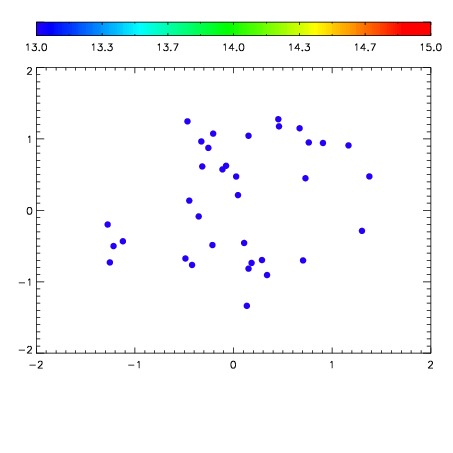

| Frame | Nreads | Zeropoints | Mag plots | Spatial mag deviation | Spatial sky 16325A emission deviations (filled: sky, open: star) | Spatial sky continuum emission | Spatial sky telluric CO2 absorption deviations (filled: H < 10) | |||||||||||||||||||||||
| 0 | 0 |
|
|
|
|
|
|
| IPAIR | NAME | SHIFT | NEWSHIFT | S/N | NAME | SHIFT | NEWSHIFT | S/N |
| 0 | 04040064 | 0.500422 | 0.00000 | 225.606 | 04040065 | 0.00320233 | 0.497220 | 253.616 |
| 1 | 04040063 | 0.499456 | 0.000966012 | 218.739 | 04040058 | 0.00000 | 0.500422 | 199.827 |
| 2 | 04040060 | 0.500241 | 0.000181019 | 179.766 | 04040062 | -0.000815429 | 0.501237 | 186.538 |
| 3 | 04040059 | 0.499318 | 0.00110400 | 77.3804 | 04040061 | -0.000266927 | 0.500689 | 175.186 |