| Red | Green | Blue | |
| z | 17.64 | ||
| znorm | Inf | ||
| sky | -Inf | -Inf | -Inf |
| S/N | 25.7 | 45.2 | 48.1 |
| S/N(c) | 0.0 | 0.0 | 0.0 |
| SN(E/C) |


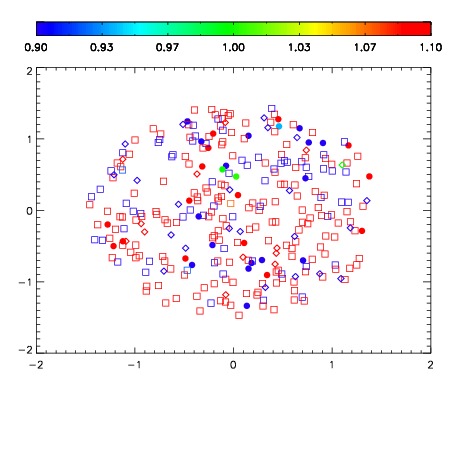


| Frame | Nreads | Zeropoints | Mag plots | Spatial mag deviation | Spatial sky 16325A emission deviations (filled: sky, open: star) | Spatial sky continuum emission | Spatial sky telluric CO2 absorption deviations (filled: H < 10) | |||||||||||||||||||||||
| 0 | 0 |
|
|
|
|
|
|
| IPAIR | NAME | SHIFT | NEWSHIFT | S/N | NAME | SHIFT | NEWSHIFT | S/N |
| 0 | 04890020 | 0.495776 | 0.00000 | 221.159 | 04890014 | 0.00000 | 0.495776 | 221.625 |
| 1 | 04890015 | 0.493922 | 0.00185400 | 227.590 | 04890021 | 0.00479167 | 0.490984 | 227.576 |
| 2 | 04890019 | 0.494399 | 0.00137699 | 218.111 | 04890018 | 0.00410139 | 0.491675 | 217.260 |
| 3 | 04890016 | 0.494963 | 0.000813007 | 210.880 | 04890017 | 0.00182602 | 0.493950 | 209.918 |