| Red | Green | Blue | |
| z | 17.64 | ||
| znorm | Inf | ||
| sky | -Inf | -NaN | -Inf |
| S/N | 27.5 | 46.7 | 50.6 |
| S/N(c) | 0.0 | 0.0 | 0.0 |
| SN(E/C) |

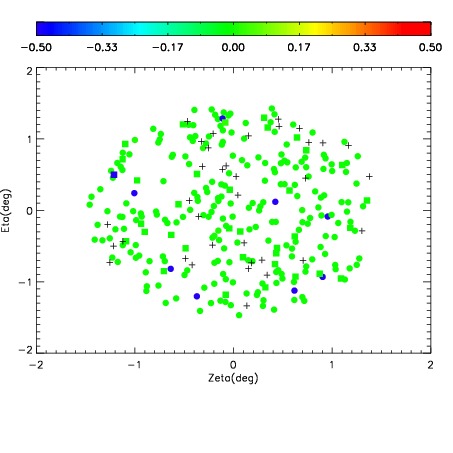
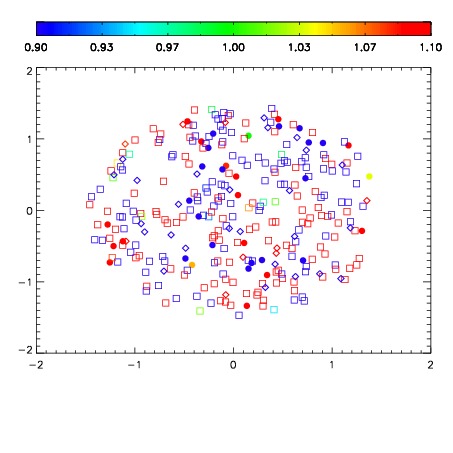
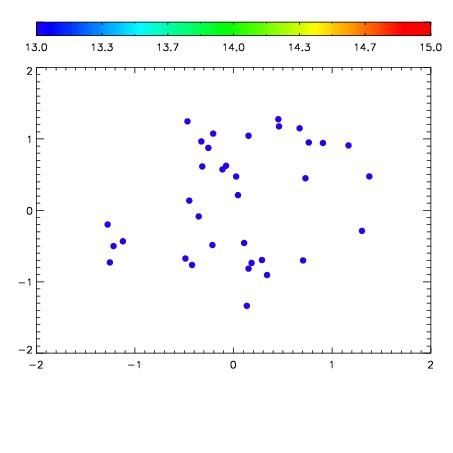

| Frame | Nreads | Zeropoints | Mag plots | Spatial mag deviation | Spatial sky 16325A emission deviations (filled: sky, open: star) | Spatial sky continuum emission | Spatial sky telluric CO2 absorption deviations (filled: H < 10) | |||||||||||||||||||||||
| 0 | 0 |
|
|
|
|
|
|
| IPAIR | NAME | SHIFT | NEWSHIFT | S/N | NAME | SHIFT | NEWSHIFT | S/N |
| 0 | 08430017 | 0.485359 | 0.00000 | 237.511 | 08430018 | -0.00234380 | 0.487703 | 239.775 |
| 1 | 08430016 | 0.485120 | 0.000239015 | 229.762 | 08430014 | 0.00283145 | 0.482528 | 230.798 |
| 2 | 08430012 | 0.483871 | 0.00148800 | 228.668 | 08430015 | -0.00142621 | 0.486785 | 228.055 |
| 3 | 08430013 | 0.483900 | 0.00145900 | 228.402 | 08430011 | 0.00000 | 0.485359 | 224.323 |