| Red | Green | Blue | |
| z | 17.64 | ||
| znorm | Inf | ||
| sky | -Inf | -Inf | -Inf |
| S/N | 18.7 | 34.7 | 37.2 |
| S/N(c) | 0.0 | 0.0 | 0.0 |
| SN(E/C) |
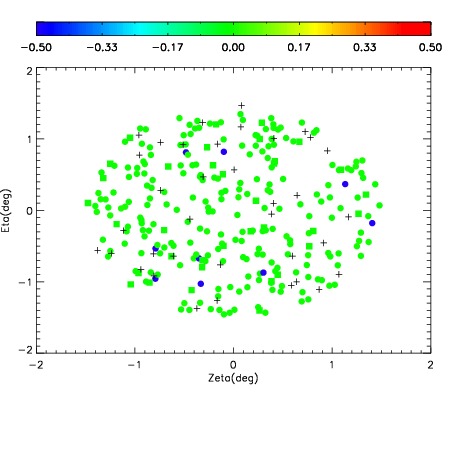
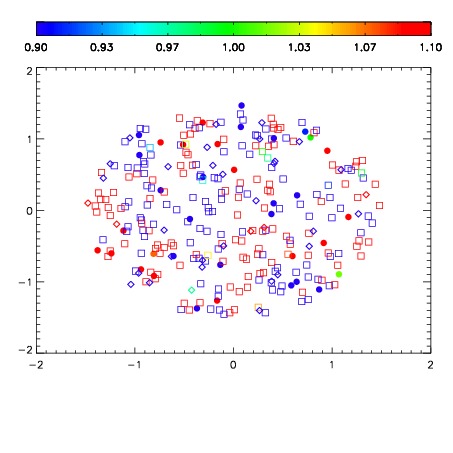
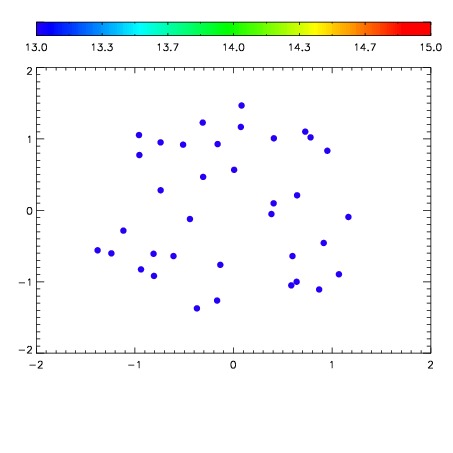

| Frame | Nreads | Zeropoints | Mag plots | Spatial mag deviation | Spatial sky 16325A emission deviations (filled: sky, open: star) | Spatial sky continuum emission | Spatial sky telluric CO2 absorption deviations (filled: H < 10) | |||||||||||||||||||||||
| 0 | 0 |
|
|
|
|
|
|
| IPAIR | NAME | SHIFT | NEWSHIFT | S/N | NAME | SHIFT | NEWSHIFT | S/N |
| 0 | 04910012 | 0.485110 | 0.00000 | 141.887 | 04910013 | 0.000534525 | 0.484575 | 140.932 |
| 1 | 04910015 | 0.483177 | 0.00193301 | 215.877 | 04910017 | 0.000123896 | 0.484986 | 211.525 |
| 2 | 04910016 | 0.484179 | 0.000931025 | 208.410 | 04910010 | 0.00000 | 0.485110 | 209.458 |
| 3 | 04910011 | 0.484224 | 0.000886023 | 149.046 | 04910014 | -0.000852799 | 0.485963 | 160.358 |