| Red | Green | Blue | |
| z | 17.64 | ||
| znorm | Inf | ||
| sky | -Inf | -Inf | -Inf |
| S/N | 24.6 | 43.3 | 46.9 |
| S/N(c) | 0.0 | 0.0 | 0.0 |
| SN(E/C) |
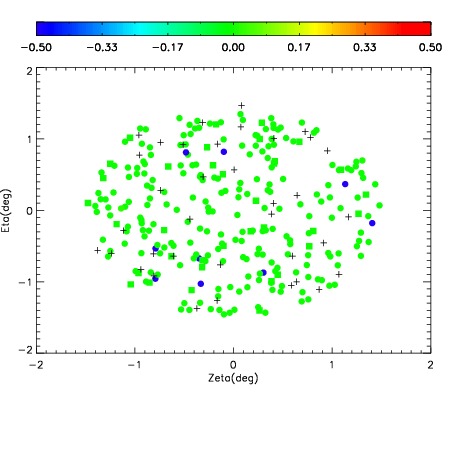
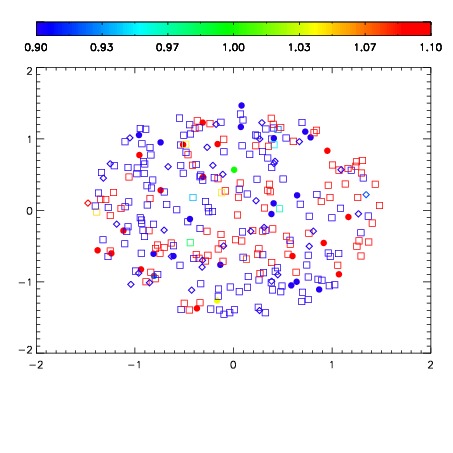
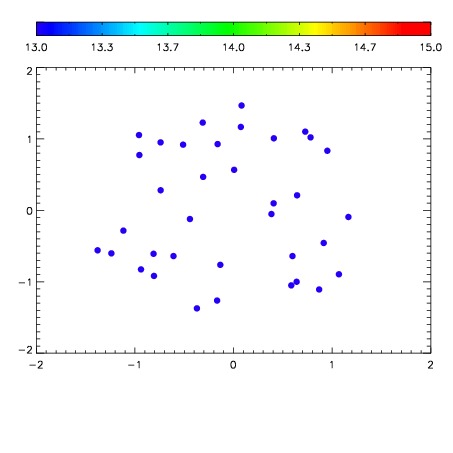

| Frame | Nreads | Zeropoints | Mag plots | Spatial mag deviation | Spatial sky 16325A emission deviations (filled: sky, open: star) | Spatial sky continuum emission | Spatial sky telluric CO2 absorption deviations (filled: H < 10) | |||||||||||||||||||||||
| 0 | 0 |
|
|
|
|
|
|
| IPAIR | NAME | SHIFT | NEWSHIFT | S/N | NAME | SHIFT | NEWSHIFT | S/N |
| 0 | 08430027 | 0.485034 | 0.00000 | 210.695 | 08430030 | 0.00243634 | 0.482598 | 208.700 |
| 1 | 08430028 | 0.484958 | 7.59959e-05 | 213.459 | 08430026 | 0.00000 | 0.485034 | 215.710 |
| 2 | 08430031 | 0.483370 | 0.00166398 | 202.539 | 08430029 | 0.00168860 | 0.483345 | 208.394 |
| 3 | 08430032 | 0.483754 | 0.00127998 | 201.101 | 08430033 | 0.00152504 | 0.483509 | 208.213 |