| Red | Green | Blue | |
| z | 17.64 | ||
| znorm | Inf | ||
| sky | -Inf | -Inf | -Inf |
| S/N | 28.3 | 45.9 | 50.2 |
| S/N(c) | 0.0 | 0.0 | 0.0 |
| SN(E/C) |
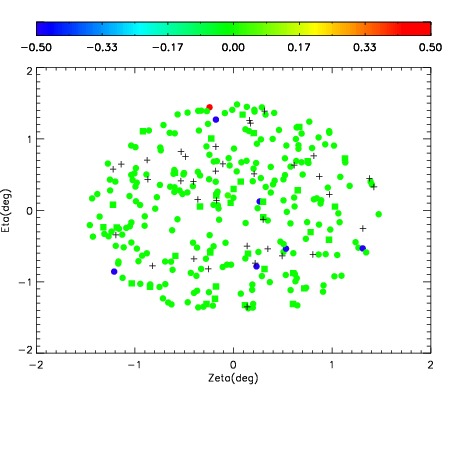
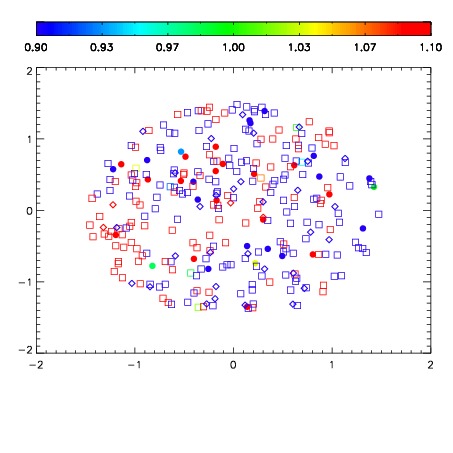
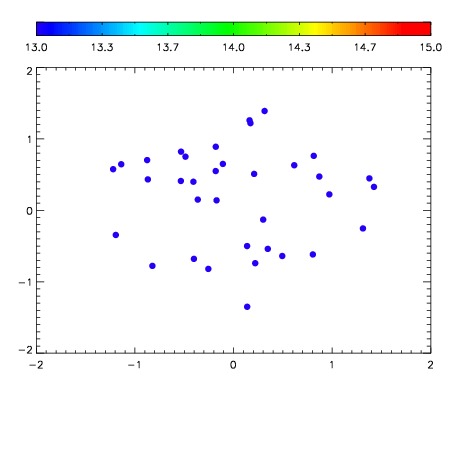

| Frame | Nreads | Zeropoints | Mag plots | Spatial mag deviation | Spatial sky 16325A emission deviations (filled: sky, open: star) | Spatial sky continuum emission | Spatial sky telluric CO2 absorption deviations (filled: H < 10) | |||||||||||||||||||||||
| 0 | 0 |
|
|
|
|
|
|
| IPAIR | NAME | SHIFT | NEWSHIFT | S/N | NAME | SHIFT | NEWSHIFT | S/N |
| 0 | 08420013 | 0.501128 | 0.00000 | 188.734 | 08420015 | 0.000186265 | 0.500942 | 190.368 |
| 1 | 08420016 | 0.413006 | 0.0881220 | 186.499 | 08420014 | -0.000168427 | 0.501296 | 188.184 |
| 2 | 08420012 | 0.500259 | 0.000869036 | 186.387 | 08420018 | -0.0779761 | 0.579104 | 185.984 |
| 3 | 08420017 | 0.413508 | 0.0876200 | 185.538 | 08420011 | 0.00000 | 0.501128 | 182.460 |