| Red | Green | Blue | |
| z | 17.64 | ||
| znorm | Inf | ||
| sky | -Inf | -Inf | -Inf |
| S/N | 23.3 | 39.4 | 43.8 |
| S/N(c) | 0.0 | 0.0 | 0.0 |
| SN(E/C) |
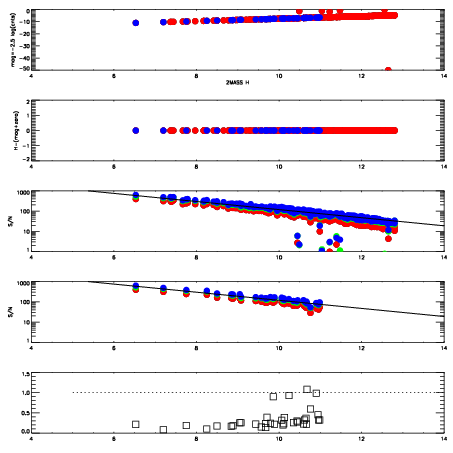

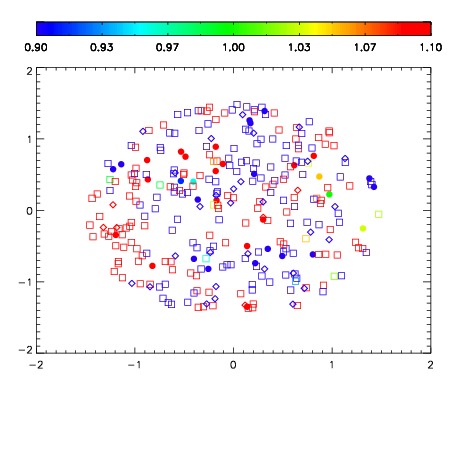
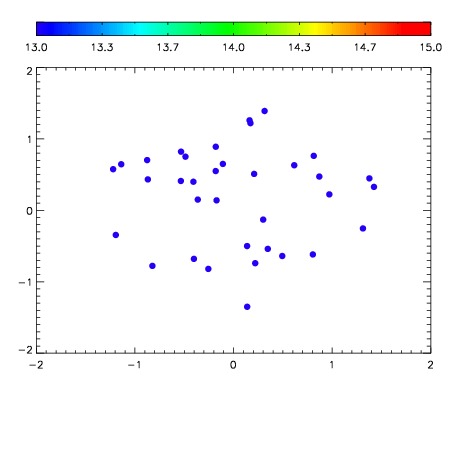

| Frame | Nreads | Zeropoints | Mag plots | Spatial mag deviation | Spatial sky 16325A emission deviations (filled: sky, open: star) | Spatial sky continuum emission | Spatial sky telluric CO2 absorption deviations (filled: H < 10) | |||||||||||||||||||||||
| 0 | 0 |
|
|
|
|
|
|
| IPAIR | NAME | SHIFT | NEWSHIFT | S/N | NAME | SHIFT | NEWSHIFT | S/N |
| 0 | 08480013 | 0.487467 | 0.00000 | 155.226 | 08480014 | -0.883331 | 1.37080 | 111.602 |
| 1 | 08480016 | 0.00446748 | 0.483000 | 172.038 | 08480015 | -0.485290 | 0.972757 | 178.100 |
| 2 | 08480017 | 0.00471575 | 0.482751 | 170.255 | 08480018 | -0.483480 | 0.970947 | 166.320 |
| 3 | 08480012 | 0.486643 | 0.000824004 | 159.998 | 08480011 | 0.00000 | 0.487467 | 140.036 |