| Red | Green | Blue | |
| z | 17.64 | ||
| znorm | Inf | ||
| sky | -Inf | -Inf | -Inf |
| S/N | 27.3 | 48.4 | 55.3 |
| S/N(c) | 0.0 | 0.0 | 0.0 |
| SN(E/C) |
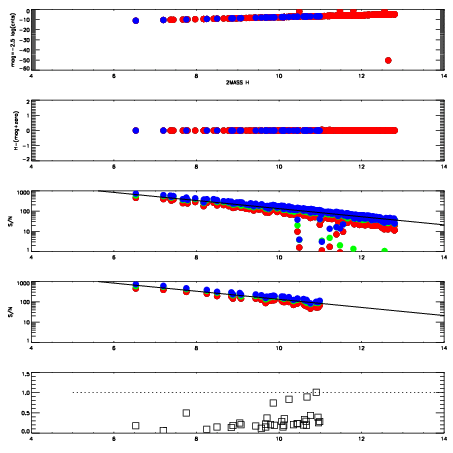
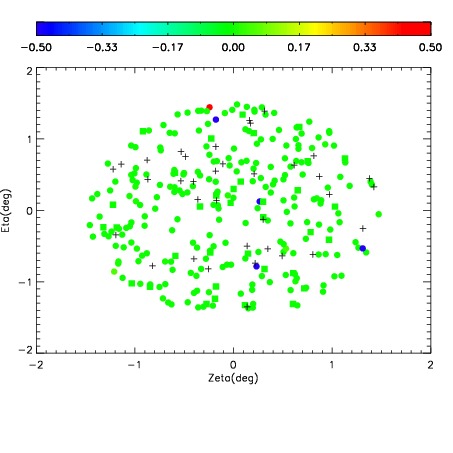
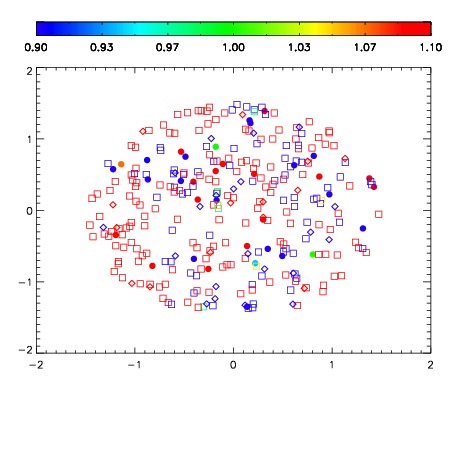


| Frame | Nreads | Zeropoints | Mag plots | Spatial mag deviation | Spatial sky 16325A emission deviations (filled: sky, open: star) | Spatial sky continuum emission | Spatial sky telluric CO2 absorption deviations (filled: H < 10) | |||||||||||||||||||||||
| 0 | 0 |
|
|
|
|
|
|
| IPAIR | NAME | SHIFT | NEWSHIFT | S/N | NAME | SHIFT | NEWSHIFT | S/N |
| 0 | 10800106 | 0.490755 | 0.00000 | 152.700 | 10800104 | -0.000673615 | 0.491429 | 147.076 |
| 1 | 10800109 | 0.489941 | 0.000813991 | 165.930 | 10800108 | 0.00178640 | 0.488969 | 166.049 |
| 2 | 10800101 | 0.489392 | 0.00136298 | 163.136 | 10800107 | 0.00196852 | 0.488786 | 164.158 |
| 3 | 10800102 | 0.489429 | 0.00132599 | 157.644 | 10800100 | 0.00000 | 0.490755 | 158.975 |
| 4 | 10800105 | 0.490124 | 0.000631005 | 152.711 | 10800103 | -0.000299026 | 0.491054 | 148.224 |