| Red | Green | Blue | |
| z | 17.64 | ||
| znorm | Inf | ||
| sky | -NaN | -Inf | -Inf |
| S/N | 20.4 | 36.8 | 41.0 |
| S/N(c) | 0.0 | 0.0 | 0.0 |
| SN(E/C) |
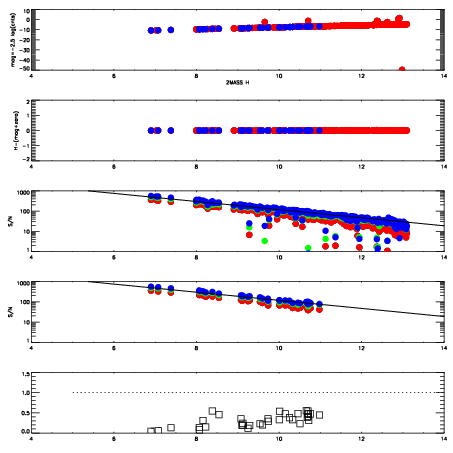
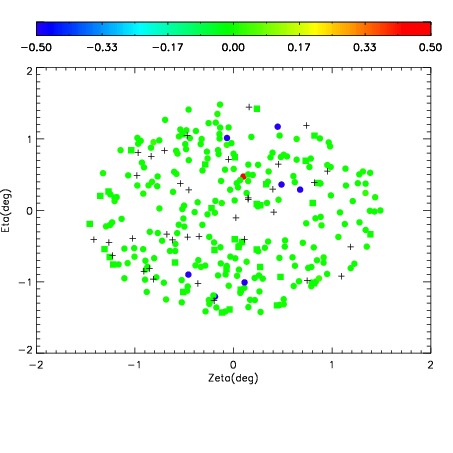
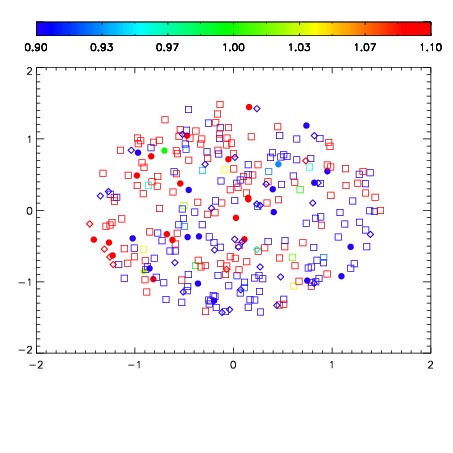
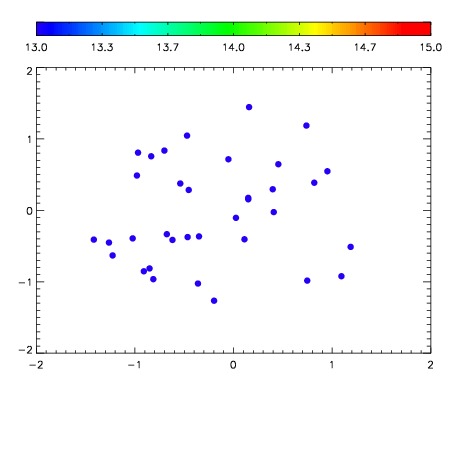

| Frame | Nreads | Zeropoints | Mag plots | Spatial mag deviation | Spatial sky 16325A emission deviations (filled: sky, open: star) | Spatial sky continuum emission | Spatial sky telluric CO2 absorption deviations (filled: H < 10) | |||||||||||||||||||||||
| 0 | 0 |
|
|
|
|
|
|
| IPAIR | NAME | SHIFT | NEWSHIFT | S/N | NAME | SHIFT | NEWSHIFT | S/N |
| 0 | 04050064 | 0.495248 | 0.00000 | 123.574 | 04050058 | 0.00000 | 0.495248 | 112.193 |
| 1 | 04050059 | 0.493775 | 0.00147298 | 149.785 | 04050061 | 0.000277882 | 0.494970 | 144.794 |
| 2 | 04050060 | 0.494532 | 0.000716001 | 145.345 | 04050062 | -0.000842797 | 0.496091 | 137.478 |
| 3 | 04050063 | 0.493653 | 0.00159499 | 128.933 | 04050065 | -0.000966521 | 0.496215 | 119.259 |