| Red | Green | Blue | |
| z | 17.64 | ||
| znorm | Inf | ||
| sky | -NaN | -Inf | -Inf |
| S/N | 28.1 | 49.4 | 54.3 |
| S/N(c) | 0.0 | 0.0 | 0.0 |
| SN(E/C) |
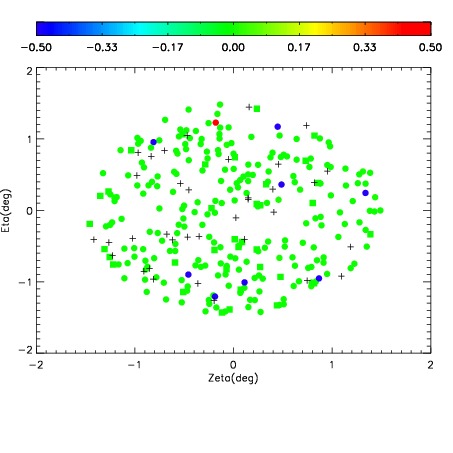
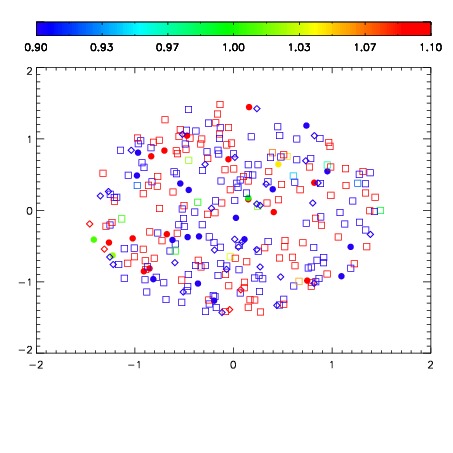
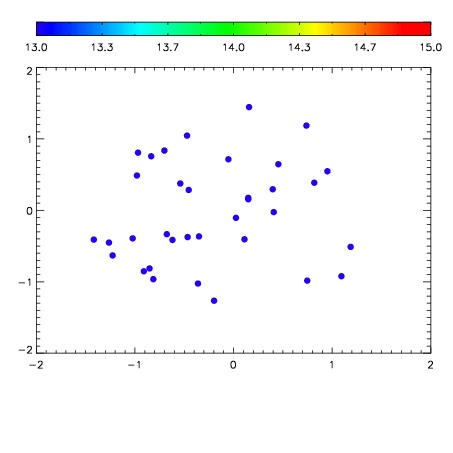

| Frame | Nreads | Zeropoints | Mag plots | Spatial mag deviation | Spatial sky 16325A emission deviations (filled: sky, open: star) | Spatial sky continuum emission | Spatial sky telluric CO2 absorption deviations (filled: H < 10) | |||||||||||||||||||||||
| 0 | 0 |
|
|
|
|
|
|
| IPAIR | NAME | SHIFT | NEWSHIFT | S/N | NAME | SHIFT | NEWSHIFT | S/N |
| 0 | 04280047 | 0.498715 | 0.00000 | 195.504 | 04280044 | -0.000597134 | 0.499312 | 197.515 |
| 1 | 04280046 | 0.494166 | 0.00454903 | 195.324 | 04280045 | -0.000689411 | 0.499404 | 197.402 |
| 2 | 04280043 | 0.497126 | 0.00158900 | 194.707 | 04280048 | -0.000360968 | 0.499076 | 196.644 |
| 3 | 04280042 | 0.493434 | 0.00528100 | 194.486 | 04280041 | 0.00000 | 0.498715 | 190.005 |