| Red | Green | Blue | |
| z | 17.64 | ||
| znorm | Inf | ||
| sky | -Inf | -Inf | -Inf |
| S/N | 25.1 | 44.7 | 50.2 |
| S/N(c) | 0.0 | 0.0 | 0.0 |
| SN(E/C) |
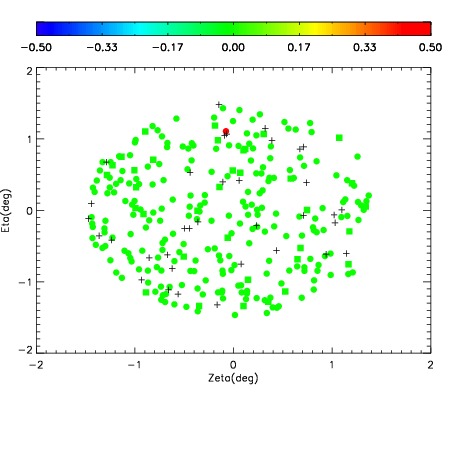
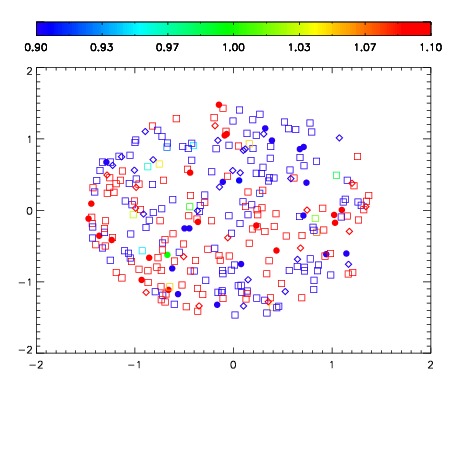
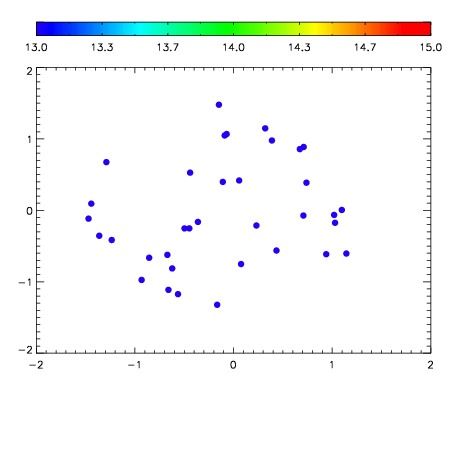

| Frame | Nreads | Zeropoints | Mag plots | Spatial mag deviation | Spatial sky 16325A emission deviations (filled: sky, open: star) | Spatial sky continuum emission | Spatial sky telluric CO2 absorption deviations (filled: H < 10) | |||||||||||||||||||||||
| 0 | 0 |
|
|
|
|
|
|
| IPAIR | NAME | SHIFT | NEWSHIFT | S/N | NAME | SHIFT | NEWSHIFT | S/N |
| 0 | 06990094 | 0.481570 | 0.00000 | 211.725 | 06990092 | 0.00000 | 0.481570 | 207.399 |
| 1 | 06990098 | 0.481014 | 0.000555992 | 220.676 | 06990096 | -0.00113956 | 0.482710 | 218.189 |
| 2 | 06990097 | 0.479017 | 0.00255302 | 215.499 | 06990095 | -0.00164529 | 0.483215 | 213.768 |
| 3 | 06990093 | 0.477638 | 0.00393200 | 209.669 | 06990100 | 0.00100372 | 0.480566 | 193.916 |
| 4 | 06990101 | 0.479055 | 0.00251502 | 149.138 | 06990099 | -0.00108510 | 0.482655 | 189.444 |