| Red | Green | Blue | |
| z | 17.64 | ||
| znorm | Inf | ||
| sky | -Inf | -Inf | -Inf |
| S/N | 22.8 | 40.9 | 43.8 |
| S/N(c) | 0.0 | 0.0 | 0.0 |
| SN(E/C) |
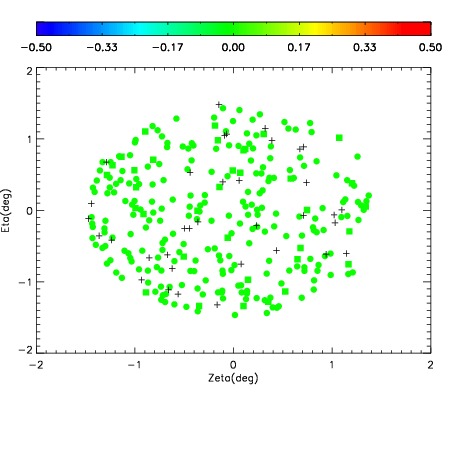
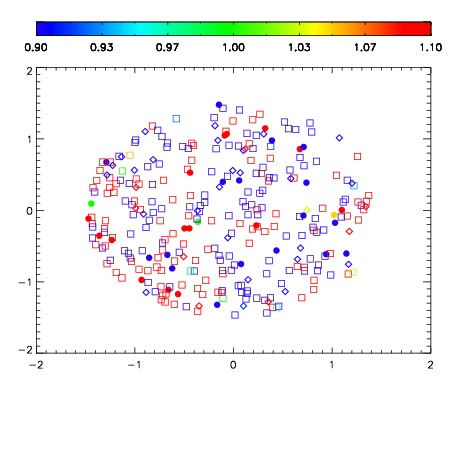
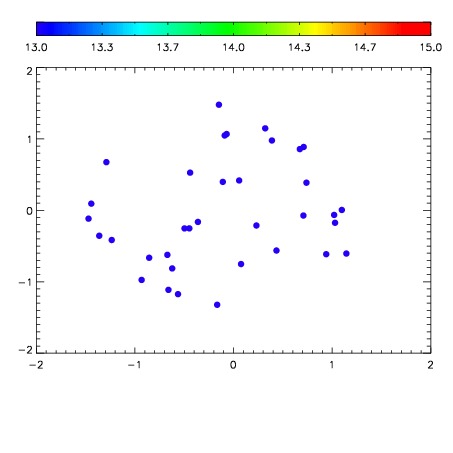

| Frame | Nreads | Zeropoints | Mag plots | Spatial mag deviation | Spatial sky 16325A emission deviations (filled: sky, open: star) | Spatial sky continuum emission | Spatial sky telluric CO2 absorption deviations (filled: H < 10) | |||||||||||||||||||||||
| 0 | 0 |
|
|
|
|
|
|
| IPAIR | NAME | SHIFT | NEWSHIFT | S/N | NAME | SHIFT | NEWSHIFT | S/N |
| 0 | 07050050 | 0.463151 | 0.00000 | 213.816 | 07050051 | 0.000498875 | 0.462652 | 217.727 |
| 1 | 07050054 | 0.461915 | 0.00123602 | 235.283 | 07050055 | -0.00177667 | 0.464928 | 240.175 |
| 2 | 07050053 | 0.461305 | 0.00184602 | 228.210 | 07050052 | 0.000591711 | 0.462559 | 227.500 |
| 3 | 07050049 | 0.462394 | 0.000757009 | 206.698 | 07050048 | 0.00000 | 0.463151 | 196.602 |