| Red | Green | Blue | |
| z | 17.64 | ||
| znorm | Inf | ||
| sky | -Inf | -Inf | -Inf |
| S/N | 30.7 | 54.6 | 60.2 |
| S/N(c) | 0.0 | 0.0 | 0.0 |
| SN(E/C) |
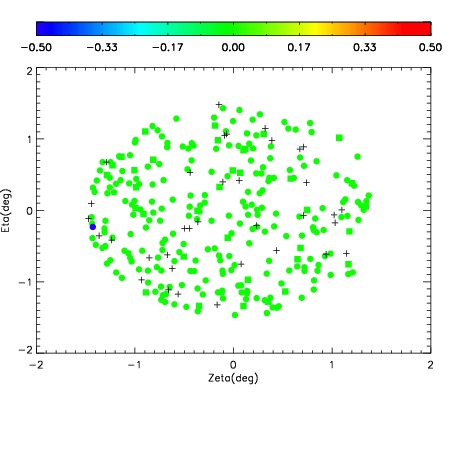
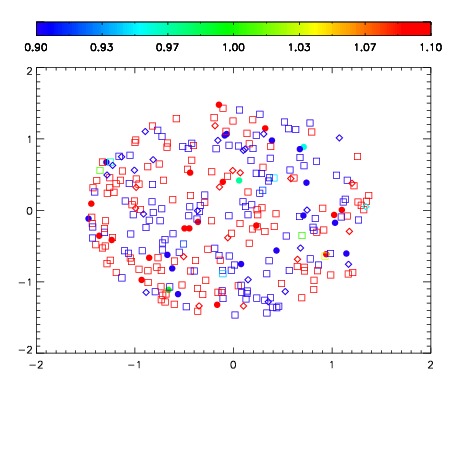
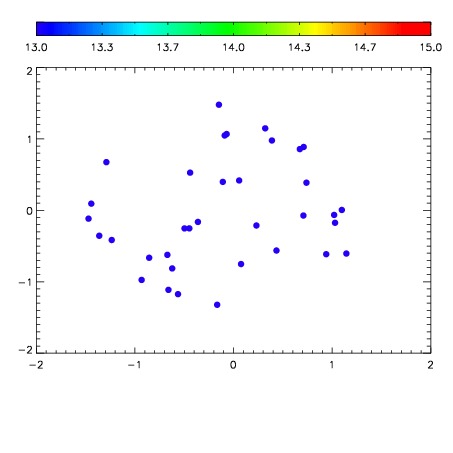

| Frame | Nreads | Zeropoints | Mag plots | Spatial mag deviation | Spatial sky 16325A emission deviations (filled: sky, open: star) | Spatial sky continuum emission | Spatial sky telluric CO2 absorption deviations (filled: H < 10) | |||||||||||||||||||||||
| 0 | 0 |
|
|
|
|
|
|
| IPAIR | NAME | SHIFT | NEWSHIFT | S/N | NAME | SHIFT | NEWSHIFT | S/N |
| 0 | 07540069 | 0.475969 | 0.00000 | 226.539 | 07540070 | 0.00814416 | 0.467825 | 231.811 |
| 1 | 07540068 | 0.475210 | 0.000758976 | 224.762 | 07540067 | 0.00199817 | 0.473971 | 228.022 |
| 2 | 07540064 | 0.475196 | 0.000772983 | 217.903 | 07540066 | 0.00484517 | 0.471124 | 221.963 |
| 3 | 07540065 | 0.475579 | 0.000389993 | 214.316 | 07540063 | 0.00266845 | 0.473301 | 216.201 |
| 4 | 07540061 | 0.475018 | 0.000950992 | 207.440 | 07540062 | 5.74273e-05 | 0.475912 | 210.358 |
| 5 | 07540060 | 0.474873 | 0.00109598 | 194.839 | 07540059 | 0.00000 | 0.475969 | 188.820 |