| Red | Green | Blue | |
| z | 17.64 | ||
| znorm | Inf | ||
| sky | -Inf | -Inf | -Inf |
| S/N | 27.3 | 45.6 | 52.1 |
| S/N(c) | 0.0 | 0.0 | 0.0 |
| SN(E/C) |
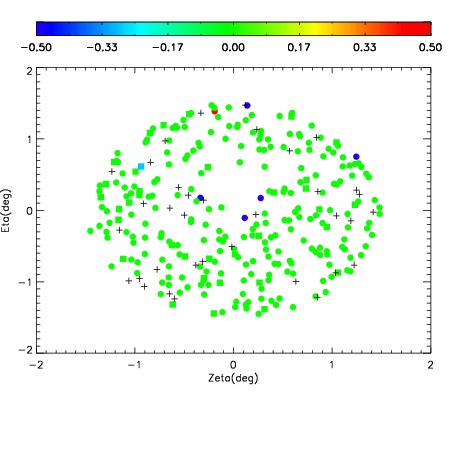

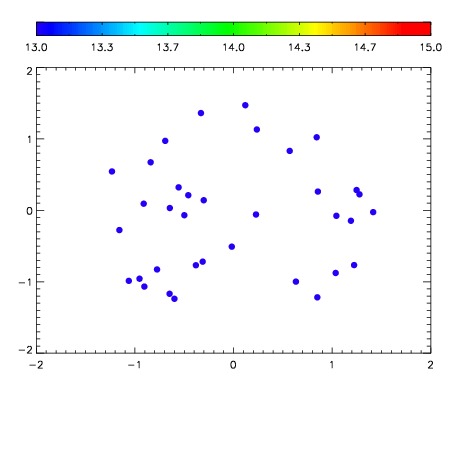

| Frame | Nreads | Zeropoints | Mag plots | Spatial mag deviation | Spatial sky 16325A emission deviations (filled: sky, open: star) | Spatial sky continuum emission | Spatial sky telluric CO2 absorption deviations (filled: H < 10) | |||||||||||||||||||||||
| 0 | 0 |
|
|
|
|
|
|
| IPAIR | NAME | SHIFT | NEWSHIFT | S/N | NAME | SHIFT | NEWSHIFT | S/N |
| 0 | 04880019 | 0.497248 | 0.00000 | 243.233 | 04880017 | 0.000166175 | 0.497082 | 245.227 |
| 1 | 04880014 | 0.496544 | 0.000703990 | 241.246 | 04880020 | -0.000195763 | 0.497444 | 244.696 |
| 2 | 04880015 | 0.497203 | 4.50015e-05 | 240.280 | 04880016 | -0.000280807 | 0.497529 | 243.850 |
| 3 | 04880018 | 0.495386 | 0.00186199 | 238.590 | 04880013 | 0.00000 | 0.497248 | 238.200 |