| Red | Green | Blue | |
| z | 17.64 | ||
| znorm | Inf | ||
| sky | -Inf | -NaN | -Inf |
| S/N | 25.2 | 44.1 | 48.4 |
| S/N(c) | 0.0 | 0.0 | 0.0 |
| SN(E/C) |


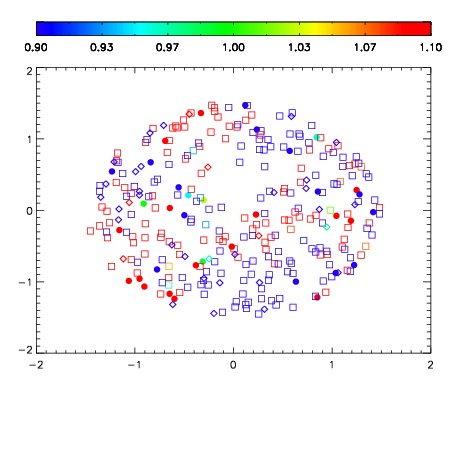


| Frame | Nreads | Zeropoints | Mag plots | Spatial mag deviation | Spatial sky 16325A emission deviations (filled: sky, open: star) | Spatial sky continuum emission | Spatial sky telluric CO2 absorption deviations (filled: H < 10) | |||||||||||||||||||||||
| 0 | 0 |
|
|
|
|
|
|
| IPAIR | NAME | SHIFT | NEWSHIFT | S/N | NAME | SHIFT | NEWSHIFT | S/N |
| 0 | 04920016 | 0.487125 | 0.00000 | 194.043 | 04920017 | -0.00234923 | 0.489474 | 194.569 |
| 1 | 04920012 | 0.486919 | 0.000206023 | 259.957 | 04920014 | -0.00325160 | 0.490377 | 264.197 |
| 2 | 04920011 | 0.485888 | 0.00123700 | 258.353 | 04920013 | -0.00335087 | 0.490476 | 258.137 |
| 3 | 04920015 | 0.482578 | 0.00454700 | 233.001 | 04920010 | 0.00000 | 0.487125 | 247.497 |