| Red | Green | Blue | |
| z | 17.64 | ||
| znorm | Inf | ||
| sky | -Inf | -Inf | -Inf |
| S/N | 30.8 | 49.8 | 55.6 |
| S/N(c) | 0.0 | 0.0 | 0.0 |
| SN(E/C) |
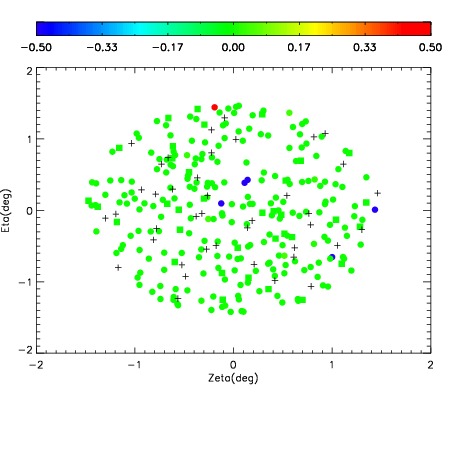
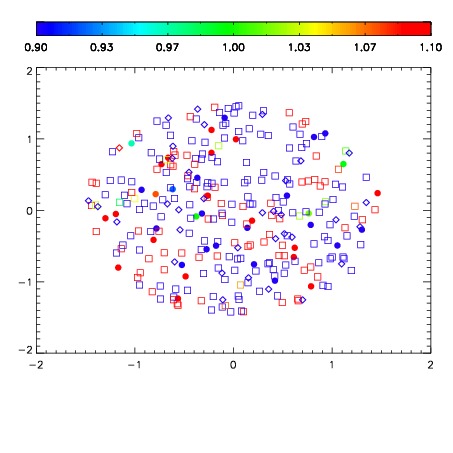
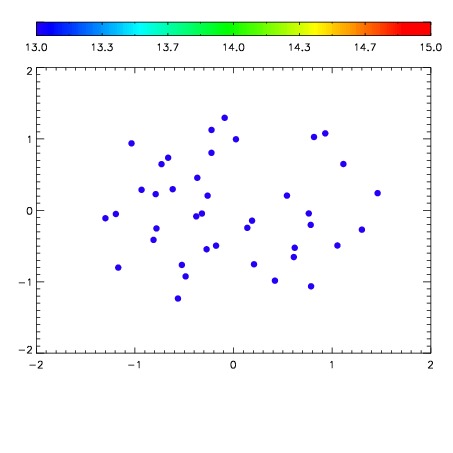

| Frame | Nreads | Zeropoints | Mag plots | Spatial mag deviation | Spatial sky 16325A emission deviations (filled: sky, open: star) | Spatial sky continuum emission | Spatial sky telluric CO2 absorption deviations (filled: H < 10) | |||||||||||||||||||||||
| 0 | 0 |
|
|
|
|
|
|
| IPAIR | NAME | SHIFT | NEWSHIFT | S/N | NAME | SHIFT | NEWSHIFT | S/N |
| 0 | 04060054 | 0.494249 | 0.00000 | 211.431 | 04060052 | -0.00125959 | 0.495509 | 209.943 |
| 1 | 04060053 | 0.492941 | 0.00130799 | 213.141 | 04060055 | 0.00138555 | 0.492863 | 214.000 |
| 2 | 04060050 | 0.491365 | 0.00288400 | 212.951 | 04060051 | -0.000737639 | 0.494987 | 210.675 |
| 3 | 04060049 | 0.490063 | 0.00418597 | 207.092 | 04060048 | 0.00000 | 0.494249 | 208.361 |