| Red | Green | Blue | |
| z | 17.64 | ||
| znorm | Inf | ||
| sky | -Inf | -NaN | -Inf |
| S/N | 23.1 | 36.3 | 42.8 |
| S/N(c) | 0.0 | 0.0 | 0.0 |
| SN(E/C) |
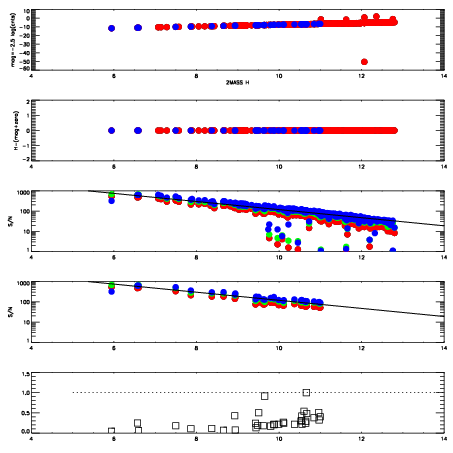
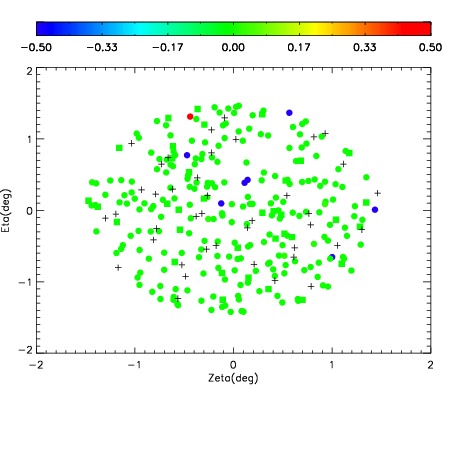
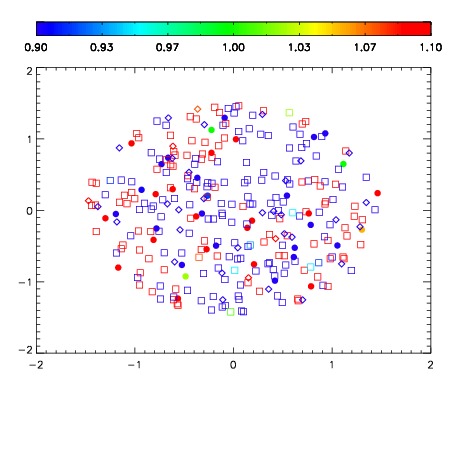
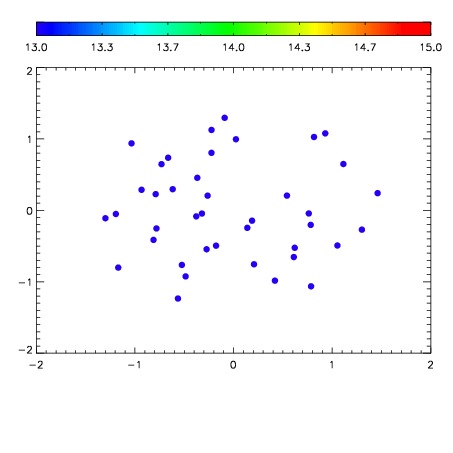

| Frame | Nreads | Zeropoints | Mag plots | Spatial mag deviation | Spatial sky 16325A emission deviations (filled: sky, open: star) | Spatial sky continuum emission | Spatial sky telluric CO2 absorption deviations (filled: H < 10) | |||||||||||||||||||||||
| 0 | 0 |
|
|
|
|
|
|
| IPAIR | NAME | SHIFT | NEWSHIFT | S/N | NAME | SHIFT | NEWSHIFT | S/N |
| 0 | 04600042 | 0.495753 | 0.00000 | 200.970 | 04600039 | 0.000699950 | 0.495053 | 209.471 |
| 1 | 04600038 | 0.494245 | 0.00150800 | 198.190 | 04600040 | 0.000937568 | 0.494815 | 204.479 |
| 2 | 04600037 | 0.494190 | 0.00156298 | 195.590 | 04600043 | 0.000557216 | 0.495196 | 195.553 |
| 3 | 04600041 | 0.493958 | 0.00179499 | 180.820 | 04600036 | 0.00000 | 0.495753 | 194.457 |