| Red | Green | Blue | |
| z | 17.64 | ||
| znorm | Inf | ||
| sky | -Inf | -Inf | -Inf |
| S/N | 19.5 | 35.1 | 40.8 |
| S/N(c) | 0.0 | 0.0 | 0.0 |
| SN(E/C) |
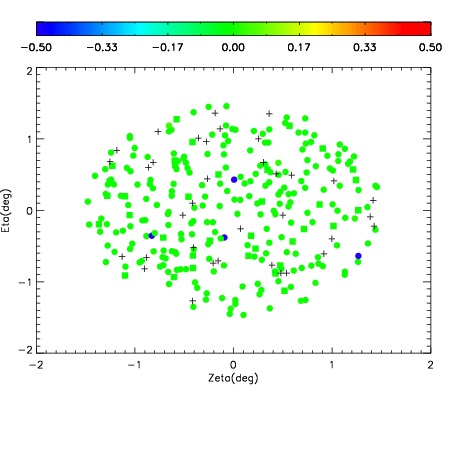
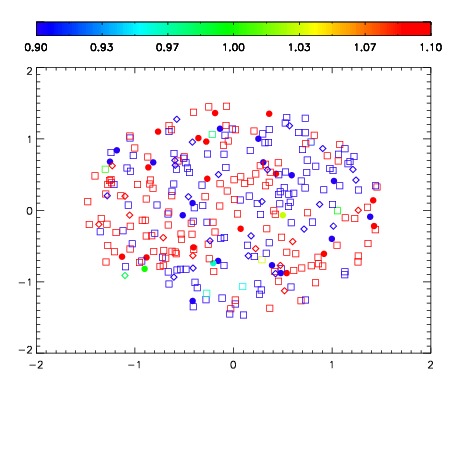
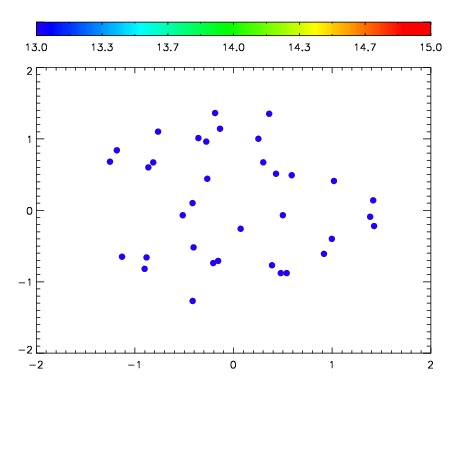

| Frame | Nreads | Zeropoints | Mag plots | Spatial mag deviation | Spatial sky 16325A emission deviations (filled: sky, open: star) | Spatial sky continuum emission | Spatial sky telluric CO2 absorption deviations (filled: H < 10) | |||||||||||||||||||||||
| 0 | 0 |
|
|
|
|
|
|
| IPAIR | NAME | SHIFT | NEWSHIFT | S/N | NAME | SHIFT | NEWSHIFT | S/N |
| 0 | 04030068 | 0.503439 | 0.00000 | 160.094 | 04030069 | 0.00164452 | 0.501795 | 160.197 |
| 1 | 04030067 | 0.502297 | 0.00114202 | 158.146 | 04030066 | 0.000582787 | 0.502856 | 159.829 |
| 2 | 04030064 | 0.500327 | 0.00311202 | 141.744 | 04030065 | 0.00244280 | 0.500996 | 153.088 |
| 3 | 04030063 | 0.499379 | 0.00406000 | 136.680 | 04030062 | 0.00000 | 0.503439 | 131.108 |