| Red | Green | Blue | |
| z | 17.64 | ||
| znorm | Inf | ||
| sky | -Inf | -Inf | -Inf |
| S/N | 21.7 | 38.9 | 42.0 |
| S/N(c) | 0.0 | 0.0 | 0.0 |
| SN(E/C) |
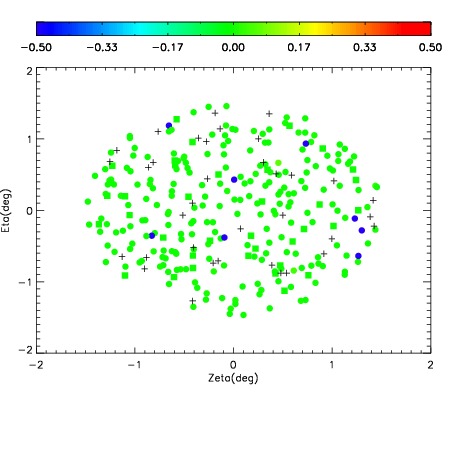
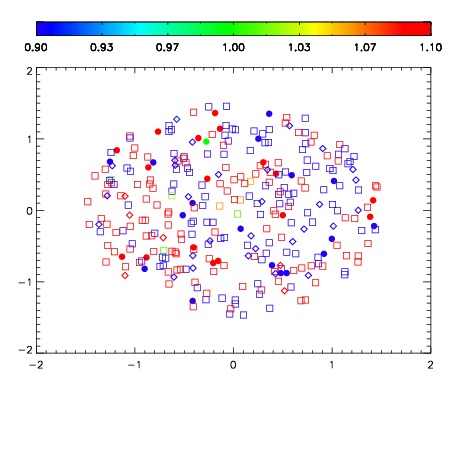
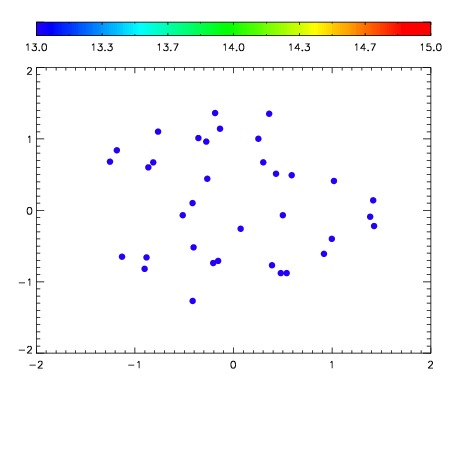

| Frame | Nreads | Zeropoints | Mag plots | Spatial mag deviation | Spatial sky 16325A emission deviations (filled: sky, open: star) | Spatial sky continuum emission | Spatial sky telluric CO2 absorption deviations (filled: H < 10) | |||||||||||||||||||||||
| 0 | 0 |
|
|
|
|
|
|
| IPAIR | NAME | SHIFT | NEWSHIFT | S/N | NAME | SHIFT | NEWSHIFT | S/N |
| 0 | 08450012 | 0.487718 | 0.00000 | 170.652 | 08450013 | 0.00305863 | 0.484659 | 170.138 |
| 1 | 08450011 | 0.487404 | 0.000313997 | 164.667 | 08450010 | 0.00000 | 0.487718 | 167.422 |
| 2 | 08450015 | 0.486865 | 0.000852972 | 162.508 | 08450014 | 0.00254539 | 0.485173 | 158.078 |
| 3 | 08450016 | 0.486905 | 0.000812978 | 159.961 | 08450017 | 0.00192340 | 0.485795 | 151.002 |