| Red | Green | Blue | |
| z | 17.64 | ||
| znorm | Inf | ||
| sky | -Inf | -Inf | -Inf |
| S/N | 15.5 | 29.0 | 35.0 |
| S/N(c) | 0.0 | 0.0 | 0.0 |
| SN(E/C) |
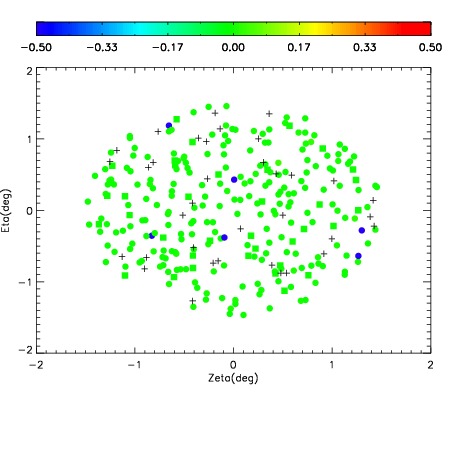
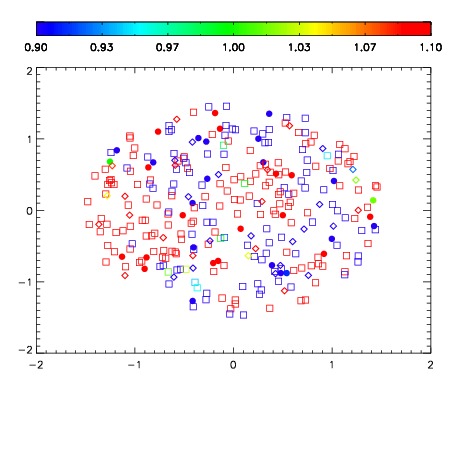
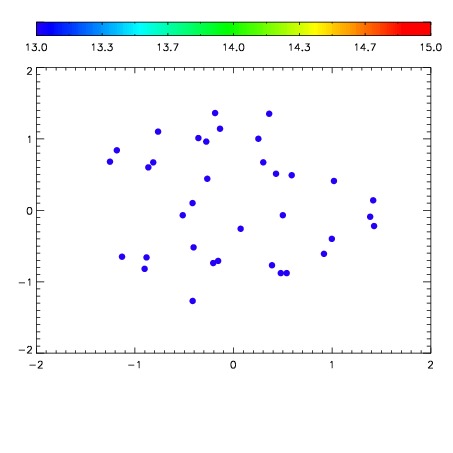

| Frame | Nreads | Zeropoints | Mag plots | Spatial mag deviation | Spatial sky 16325A emission deviations (filled: sky, open: star) | Spatial sky continuum emission | Spatial sky telluric CO2 absorption deviations (filled: H < 10) | |||||||||||||||||||||||
| 0 | 0 |
|
|
|
|
|
|
| IPAIR | NAME | SHIFT | NEWSHIFT | S/N | NAME | SHIFT | NEWSHIFT | S/N |
| 0 | 10810090 | 0.483874 | 0.00000 | 136.741 | 10810088 | 0.000915448 | 0.482959 | 128.672 |
| 1 | 10810087 | 0.482922 | 0.000952005 | 144.105 | 10810092 | -0.000798175 | 0.484672 | 133.141 |
| 2 | 10810086 | 0.482776 | 0.00109801 | 141.356 | 10810085 | 0.00000 | 0.483874 | 130.350 |
| 3 | 10810091 | 0.483620 | 0.000254005 | 136.696 | 10810089 | 0.00126713 | 0.482607 | 127.624 |