| Frame | Nreads | Zeropoints | Mag plots
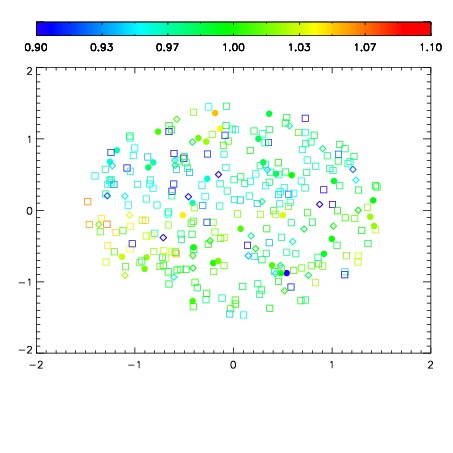
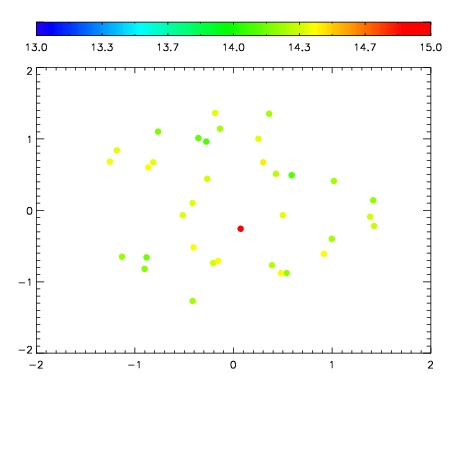
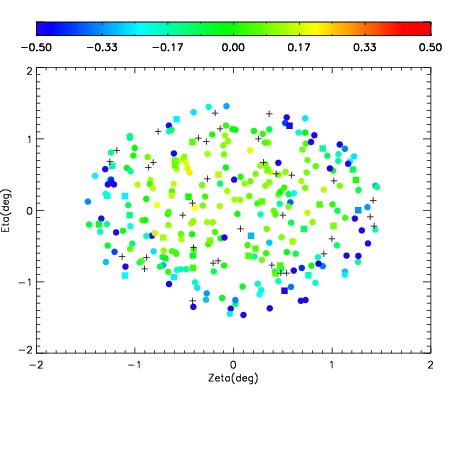
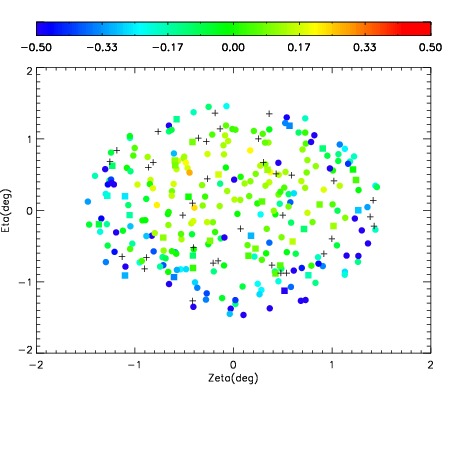
| Spatial mag deviation
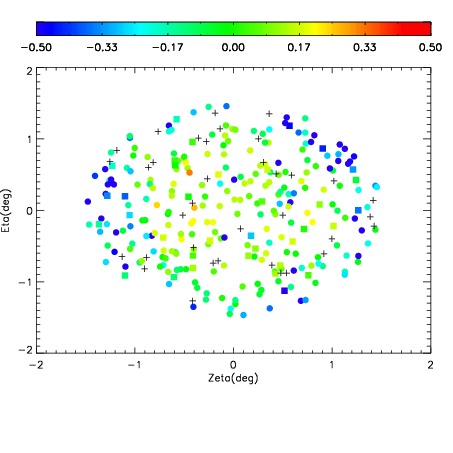
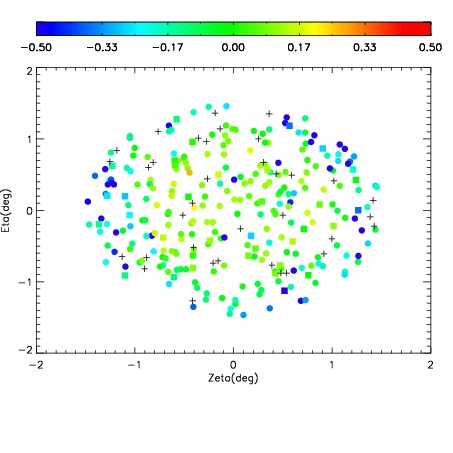
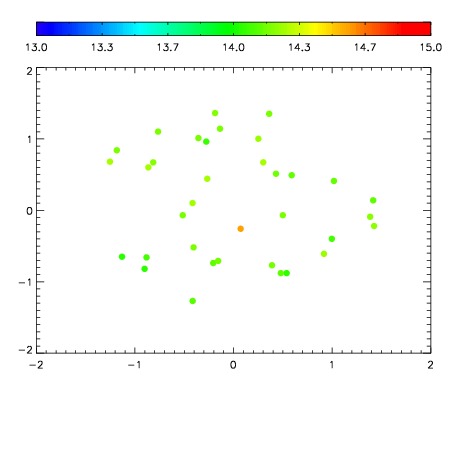
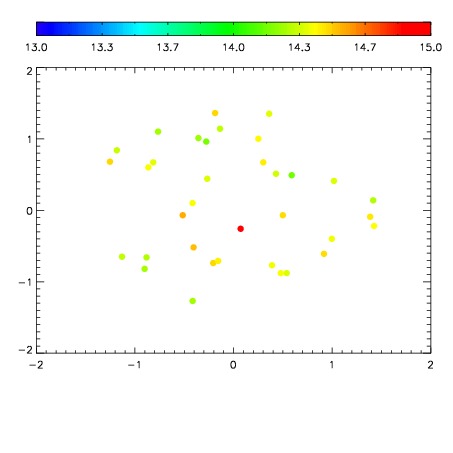
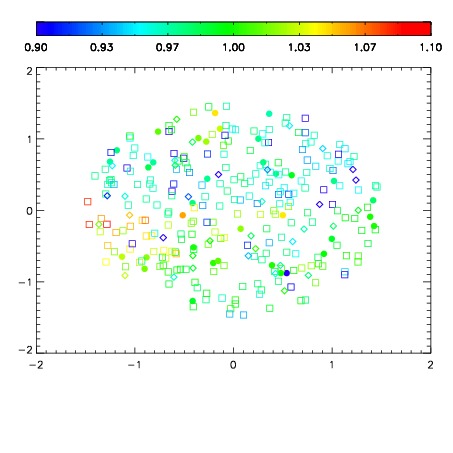
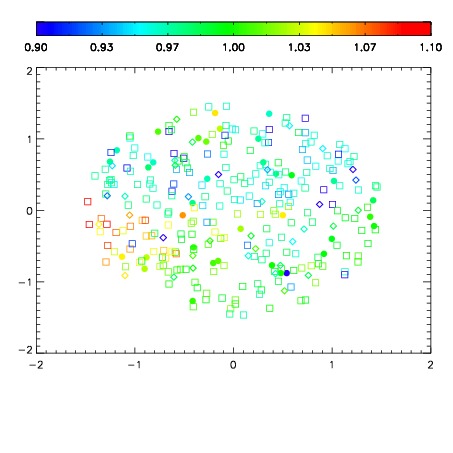
| Spatial sky 16325A emission deviations (filled: sky, open: star)
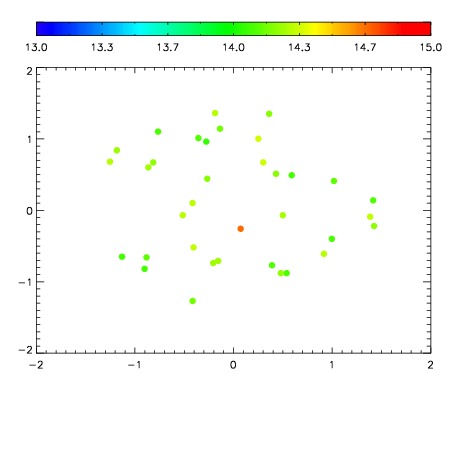
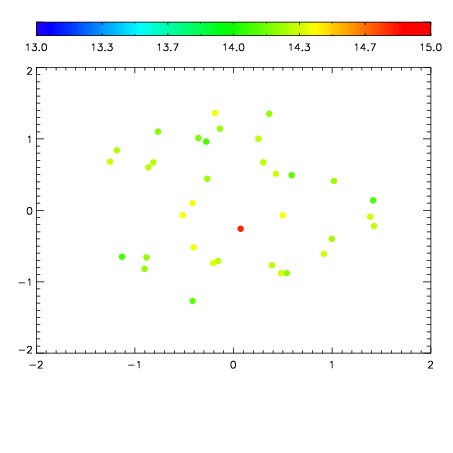
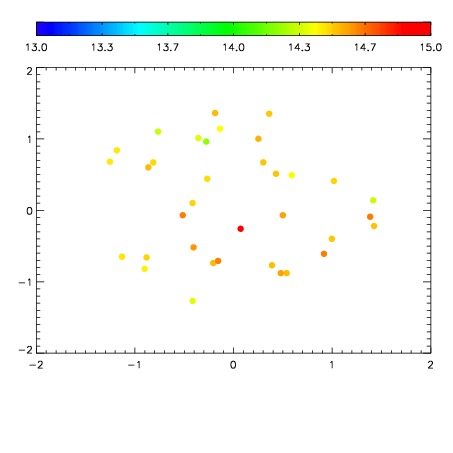
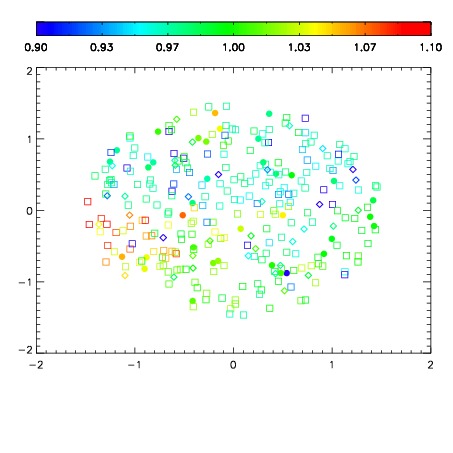
| Spatial sky continuum emission
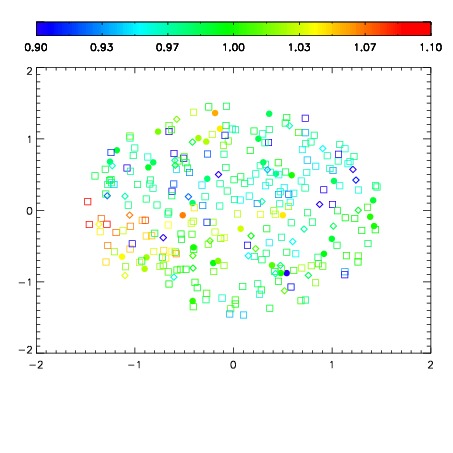
| Spatial sky telluric CO2 absorption deviations (filled: H < 10)
|
| 10820100
| 47
| | Red | Green | Blue
| | z | | 18.80
| | znorm | | 14.62
| | sky | 14.5 | 14.1 | 14.1
| | S/N | 12.8 | 20.8 | 23.7
| | S/N(c) | 10.8 | 19.4 | 22.4
| | SN(E/C) 0.44
|
| 
| 
| 
| 
| 
|
| 10820101
| 47
| | Red | Green | Blue
| | z | | 18.71
| | znorm | | 14.52
| | sky | 14.4 | 14.2 | 14.3
| | S/N | 12.2 | 19.6 | 22.6
| | S/N(c) | 10.2 | 18.1 | 21.0
| | SN(E/C) 0.46
|
| 
| 
| 
| 
| 
|
| 10820102
| 47
| | Red | Green | Blue
| | z | | 18.96
| | znorm | | 14.78
| | sky | 14.5 | 14.2 | 14.4
| | S/N | 14.4 | 22.6 | 25.0
| | S/N(c) | 12.3 | 21.1 | 23.7
| | SN(E/C) 0.45
|
| 
| 
| 
| 
| 
|
| 10820103
| 47
| | Red | Green | Blue
| | z | | 18.88
| | znorm | | 14.70
| | sky | 14.6 | 14.3 | 14.3
| | S/N | 13.5 | 21.8 | 24.3
| | S/N(c) | 11.4 | 20.1 | 22.7
| | SN(E/C) 0.42
|
| 
| 
| 
| 
| 
|
| 10820104
| 47
| | Red | Green | Blue
| | z | | 19.03
| | znorm | | 14.85
| | sky | 14.7 | 14.3 | 14.4
| | S/N | 14.4 | 23.1 | 26.2
| | S/N(c) | 12.4 | 21.6 | 24.4
| | SN(E/C) 0.43
|
| 
| 
| 
| 
| 
|
| 10820105
| 47
| | Red | Green | Blue
| | z | | 19.02
| | znorm | | 14.84
| | sky | 14.6 | 14.4 | 14.4
| | S/N | 14.2 | 22.9 | 25.7
| | S/N(c) | 12.1 | 21.3 | 23.9
| | SN(E/C) 0.43
|
| 
| 
| 
| 
| 
|
| 10820106
| 47
| | Red | Green | Blue
| | z | | 18.96
| | znorm | | 14.78
| | sky | 14.7 | 14.4 | 14.4
| | S/N | 13.8 | 22.3 | 24.8
| | S/N(c) | 11.7 | 20.9 | 23.0
| | SN(E/C) 0.44
|
| 
| 
| 
| 
| 
|
| 10820107
| 47
| | Red | Green | Blue
| | z | | 19.02
| | znorm | | 14.84
| | sky | 14.8 | 14.5 | 14.5
| | S/N | 13.8 | 22.7 | 25.5
| | S/N(c) | 11.8 | 20.8 | 23.8
| | SN(E/C) 0.43
|
| 
| 
| 
| 
| 
|
| 10820108
| 47
| | Red | Green | Blue
| | z | | 18.69
| | znorm | | 14.51
| | sky | 14.4 | 14.3 | 14.4
| | S/N | 11.3 | 18.6 | 21.6
| | S/N(c) | 9.7 | 17.1 | 20.1
| | SN(E/C) 0.50
|
| 
| 
| 
| 
| 
|
| 10820109
| 47
| | Red | Green | Blue
| | z | | 18.91
| | znorm | | 14.73
| | sky | 14.5 | 14.4 | 14.5
| | S/N | 13.1 | 21.0 | 23.5
| | S/N(c) | 11.1 | 19.2 | 22.2
| | SN(E/C) 0.44
|
| 
| 
| 
| 
| 
|