| Red | Green | Blue | |
| z | 17.64 | ||
| znorm | Inf | ||
| sky | -Inf | -Inf | -Inf |
| S/N | 21.2 | 41.1 | 46.1 |
| S/N(c) | 0.0 | 0.0 | 0.0 |
| SN(E/C) |
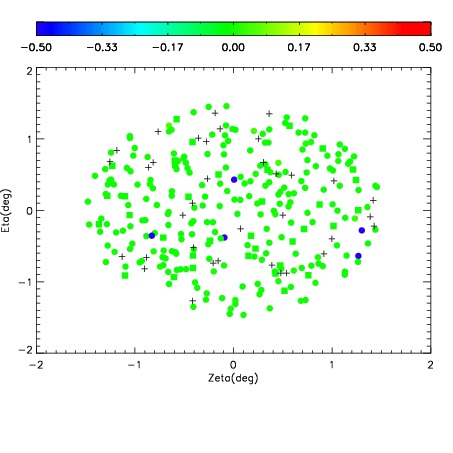
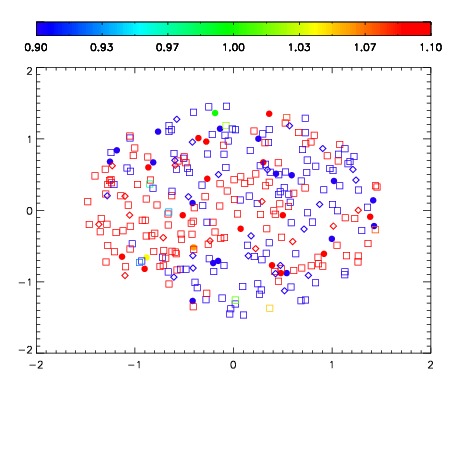
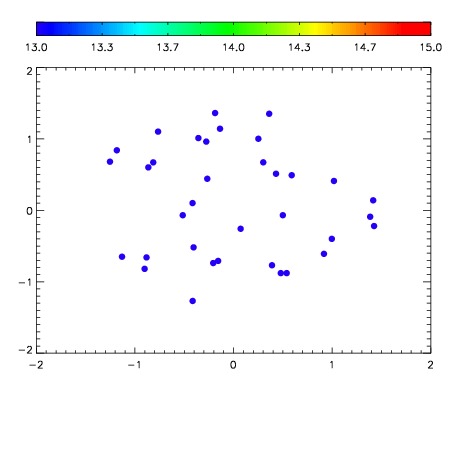

| Frame | Nreads | Zeropoints | Mag plots | Spatial mag deviation | Spatial sky 16325A emission deviations (filled: sky, open: star) | Spatial sky continuum emission | Spatial sky telluric CO2 absorption deviations (filled: H < 10) | |||||||||||||||||||||||
| 0 | 0 |
|
|
|
|
|
|
| IPAIR | NAME | SHIFT | NEWSHIFT | S/N | NAME | SHIFT | NEWSHIFT | S/N |
| 0 | 10910087 | 0.512557 | 0.00000 | 136.853 | 10910085 | -0.00179491 | 0.514352 | 142.895 |
| 1 | 10910078 | 0.509967 | 0.00259000 | 170.771 | 10910077 | 0.00000 | 0.512557 | 157.343 |
| 2 | 10910083 | 0.511591 | 0.000966012 | 160.083 | 10910080 | -0.00191223 | 0.514469 | 152.039 |
| 3 | 10910079 | 0.511104 | 0.00145304 | 156.879 | 10910084 | -0.00222260 | 0.514780 | 151.986 |
| 4 | 10910086 | 0.512039 | 0.000518024 | 144.262 | 10910081 | -0.00157443 | 0.514131 | 150.314 |
| 5 | 10910082 | 0.511405 | 0.00115204 | 130.227 | 10910088 | -0.000476573 | 0.513034 | 124.611 |