| Red | Green | Blue | |
| z | 17.64 | ||
| znorm | Inf | ||
| sky | -Inf | -Inf | -Inf |
| S/N | 27.2 | 48.8 | 53.9 |
| S/N(c) | 0.0 | 0.0 | 0.0 |
| SN(E/C) |
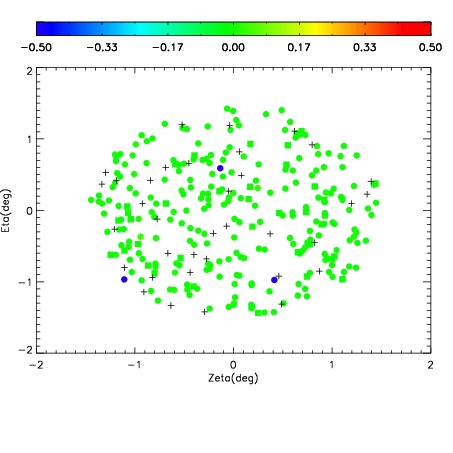
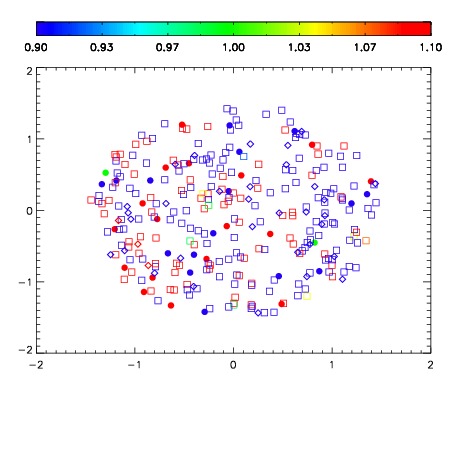


| Frame | Nreads | Zeropoints | Mag plots | Spatial mag deviation | Spatial sky 16325A emission deviations (filled: sky, open: star) | Spatial sky continuum emission | Spatial sky telluric CO2 absorption deviations (filled: H < 10) | |||||||||||||||||||||||
| 0 | 0 |
|
|
|
|
|
|
| IPAIR | NAME | SHIFT | NEWSHIFT | S/N | NAME | SHIFT | NEWSHIFT | S/N |
| 0 | 04060043 | 0.496318 | 0.00000 | 235.162 | 04060040 | 0.00157558 | 0.494742 | 231.305 |
| 1 | 04060042 | 0.494764 | 0.00155401 | 226.819 | 04060044 | 0.00323002 | 0.493088 | 229.080 |
| 2 | 04060039 | 0.493362 | 0.00295600 | 218.606 | 04060041 | 0.00146173 | 0.494856 | 226.382 |
| 3 | 04060038 | 0.492496 | 0.00382200 | 209.685 | 04060037 | 0.00000 | 0.496318 | 214.757 |