| Red | Green | Blue | |
| z | 17.64 | ||
| znorm | Inf | ||
| sky | -Inf | -Inf | -Inf |
| S/N | 22.9 | 40.8 | 43.5 |
| S/N(c) | 0.0 | 0.0 | 0.0 |
| SN(E/C) |
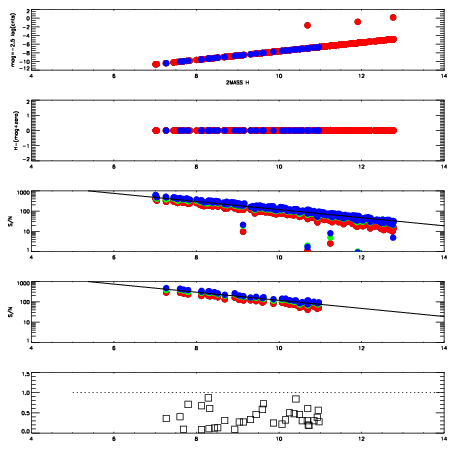
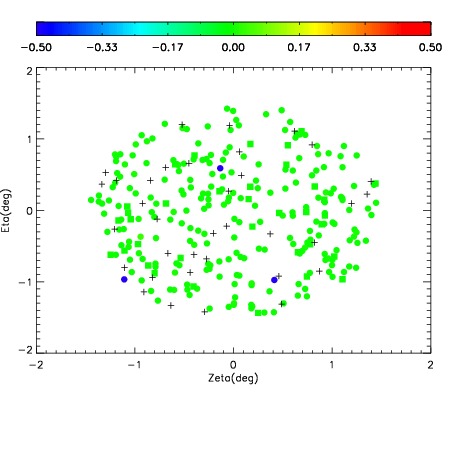
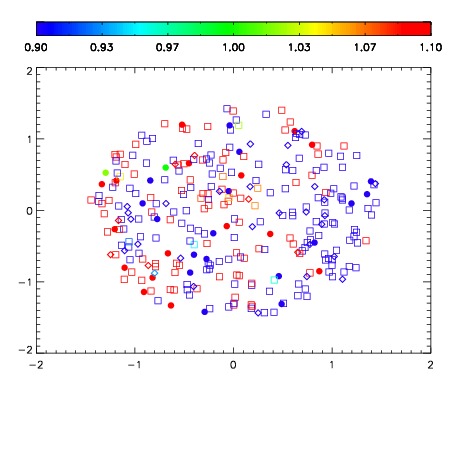


| Frame | Nreads | Zeropoints | Mag plots | Spatial mag deviation | Spatial sky 16325A emission deviations (filled: sky, open: star) | Spatial sky continuum emission | Spatial sky telluric CO2 absorption deviations (filled: H < 10) | |||||||||||||||||||||||
| 0 | 0 |
|
|
|
|
|
|
| IPAIR | NAME | SHIFT | NEWSHIFT | S/N | NAME | SHIFT | NEWSHIFT | S/N |
| 0 | 08410013 | 0.508015 | 0.00000 | 195.276 | 08410011 | 0.00000 | 0.508015 | 190.714 |
| 1 | 08410017 | 0.505196 | 0.00281900 | 212.872 | 08410018 | 0.00380852 | 0.504206 | 213.058 |
| 2 | 08410016 | 0.504445 | 0.00356996 | 209.182 | 08410015 | 0.00133921 | 0.506676 | 198.315 |
| 3 | 08410012 | 0.507070 | 0.000944972 | 195.840 | 08410014 | 0.00182285 | 0.506192 | 193.514 |