| Red | Green | Blue | |
| z | 17.64 | ||
| znorm | Inf | ||
| sky | -Inf | -Inf | -Inf |
| S/N | 24.7 | 42.3 | 46.0 |
| S/N(c) | 0.0 | 0.0 | 0.0 |
| SN(E/C) |
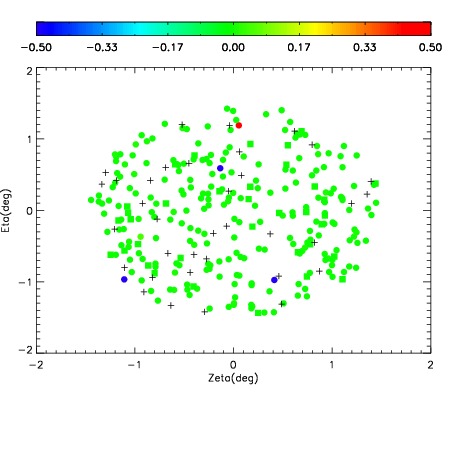

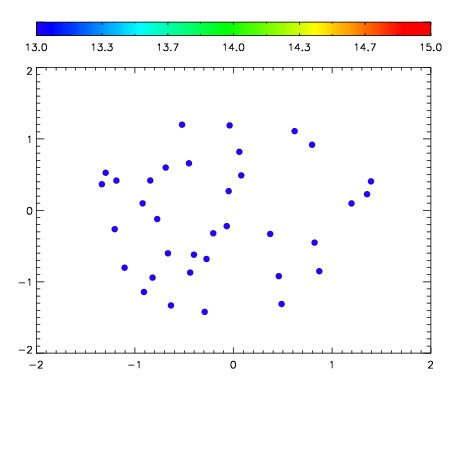

| Frame | Nreads | Zeropoints | Mag plots | Spatial mag deviation | Spatial sky 16325A emission deviations (filled: sky, open: star) | Spatial sky continuum emission | Spatial sky telluric CO2 absorption deviations (filled: H < 10) | |||||||||||||||||||||||
| 0 | 0 |
|
|
|
|
|
|
| IPAIR | NAME | SHIFT | NEWSHIFT | S/N | NAME | SHIFT | NEWSHIFT | S/N |
| 0 | 08470036 | 0.486976 | 0.00000 | 215.996 | 08470037 | 0.00627431 | 0.480702 | 194.471 |
| 1 | 08470040 | 0.486308 | 0.000667989 | 223.905 | 08470041 | 0.00406851 | 0.482907 | 216.414 |
| 2 | 08470035 | 0.486796 | 0.000180006 | 222.560 | 08470034 | 0.00000 | 0.486976 | 214.859 |
| 3 | 08470039 | 0.485154 | 0.00182199 | 211.258 | 08470038 | 0.00364984 | 0.483326 | 171.780 |