| Red | Green | Blue | |
| z | 17.64 | ||
| znorm | Inf | ||
| sky | -Inf | -Inf | -Inf |
| S/N | 26.3 | 47.6 | 52.6 |
| S/N(c) | 0.0 | 0.0 | 0.0 |
| SN(E/C) |
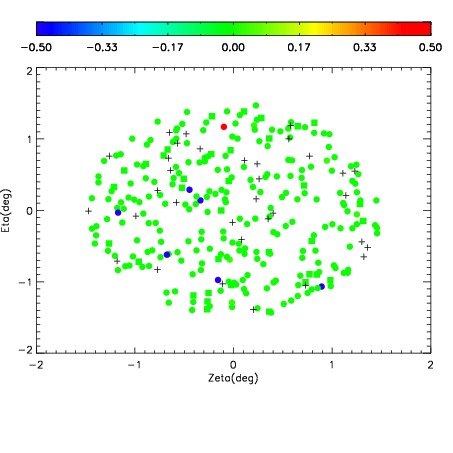
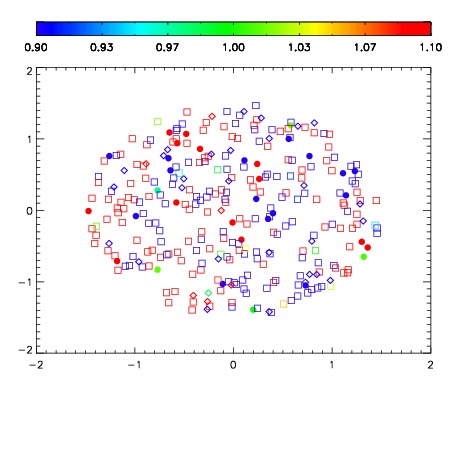


| Frame | Nreads | Zeropoints | Mag plots | Spatial mag deviation | Spatial sky 16325A emission deviations (filled: sky, open: star) | Spatial sky continuum emission | Spatial sky telluric CO2 absorption deviations (filled: H < 10) | |||||||||||||||||||||||
| 0 | 0 |
|
|
|
|
|
|
| IPAIR | NAME | SHIFT | NEWSHIFT | S/N | NAME | SHIFT | NEWSHIFT | S/N |
| 0 | 11350075 | 0.481156 | 0.00000 | 185.562 | 11350076 | -0.000345687 | 0.481502 | 185.896 |
| 1 | 11350074 | 0.480582 | 0.000573993 | 187.010 | 11350077 | -0.000132397 | 0.481288 | 188.787 |
| 2 | 11350078 | 0.480969 | 0.000186980 | 182.218 | 11350073 | -0.000205599 | 0.481362 | 183.580 |
| 3 | 11350070 | 0.478562 | 0.00259399 | 179.550 | 11350072 | -0.00102194 | 0.482178 | 173.896 |
| 4 | 11350071 | 0.480606 | 0.000550002 | 175.089 | 11350069 | 0.00000 | 0.481156 | 161.354 |