| Red | Green | Blue | |
| z | 17.64 | ||
| znorm | Inf | ||
| sky | -Inf | -Inf | -Inf |
| S/N | 14.8 | 26.4 | 29.6 |
| S/N(c) | 0.0 | 0.0 | 0.0 |
| SN(E/C) |
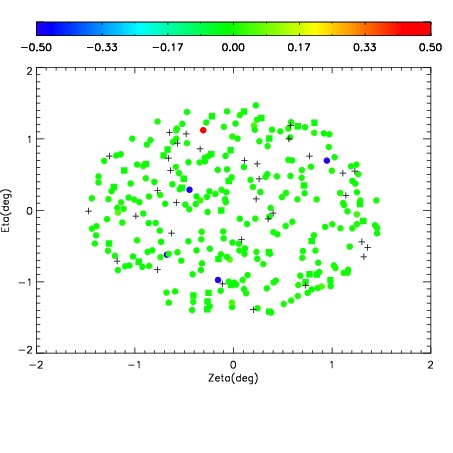
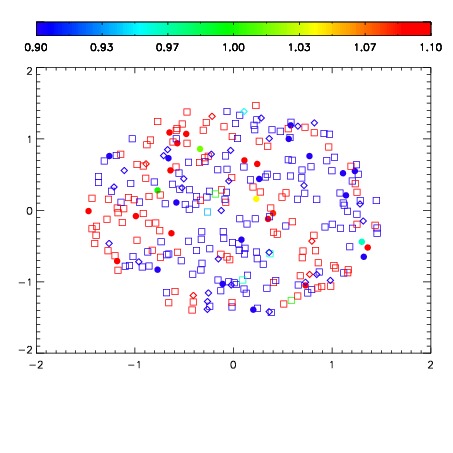
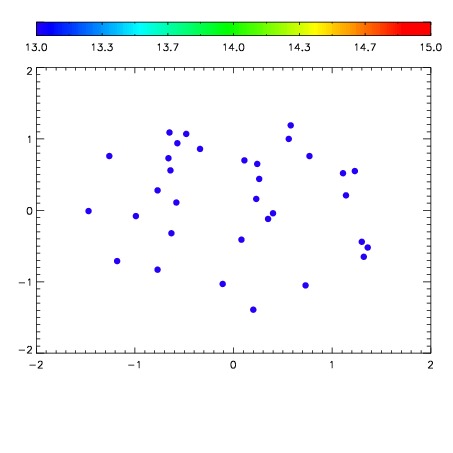

| Frame | Nreads | Zeropoints | Mag plots | Spatial mag deviation | Spatial sky 16325A emission deviations (filled: sky, open: star) | Spatial sky continuum emission | Spatial sky telluric CO2 absorption deviations (filled: H < 10) | |||||||||||||||||||||||
| 0 | 0 |
|
|
|
|
|
|
| IPAIR | NAME | SHIFT | NEWSHIFT | S/N | NAME | SHIFT | NEWSHIFT | S/N |
| 0 | 11730049 | 0.492203 | 0.00000 | 77.4142 | 11730051 | -0.00448963 | 0.496693 | 71.3370 |
| 1 | 11730046 | 0.491119 | 0.00108400 | 179.607 | 11730047 | -0.00317687 | 0.495380 | 175.536 |
| 2 | 11730045 | 0.491095 | 0.00110799 | 135.407 | 11730048 | -0.00335980 | 0.495563 | 164.739 |
| 3 | 11730050 | 0.491610 | 0.000593007 | 83.5115 | 11730044 | 0.00000 | 0.492203 | 164.520 |