| Red | Green | Blue | |
| z | 17.64 | ||
| znorm | Inf | ||
| sky | -Inf | -Inf | -Inf |
| S/N | 22.1 | 40.3 | 43.7 |
| S/N(c) | 0.0 | 0.0 | 0.0 |
| SN(E/C) |

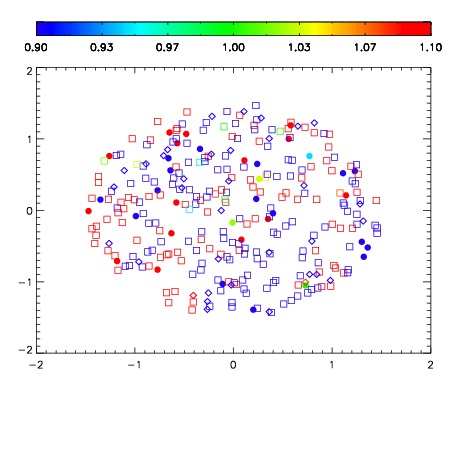
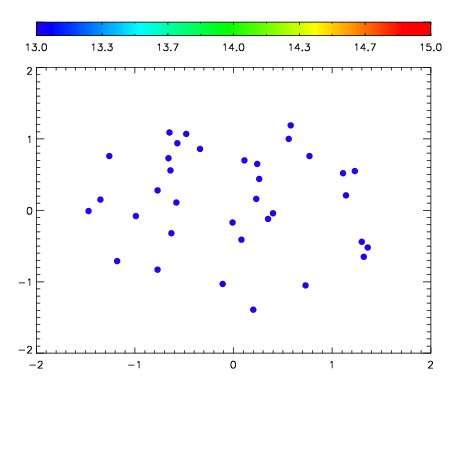

| Frame | Nreads | Zeropoints | Mag plots | Spatial mag deviation | Spatial sky 16325A emission deviations (filled: sky, open: star) | Spatial sky continuum emission | Spatial sky telluric CO2 absorption deviations (filled: H < 10) | |||||||||||||||||||||||
| 0 | 0 |
|
|
|
|
|
|
| IPAIR | NAME | SHIFT | NEWSHIFT | S/N | NAME | SHIFT | NEWSHIFT | S/N |
| 0 | 12000028 | 0.503090 | 0.00000 | 166.354 | 12000029 | -0.00145353 | 0.504544 | 169.725 |
| 1 | 12000027 | 0.501742 | 0.00134802 | 174.581 | 12000026 | -0.00400014 | 0.507090 | 173.576 |
| 2 | 12000024 | 0.500837 | 0.00225300 | 170.203 | 12000025 | -0.00434292 | 0.507433 | 172.468 |
| 3 | 12000023 | 0.500061 | 0.00302905 | 157.989 | 12000022 | 0.00000 | 0.503090 | 150.030 |