| Red | Green | Blue | |
| z | 17.64 | ||
| znorm | Inf | ||
| sky | -Inf | -Inf | -Inf |
| S/N | 24.3 | 42.9 | 46.6 |
| S/N(c) | 0.0 | 0.0 | 0.0 |
| SN(E/C) |
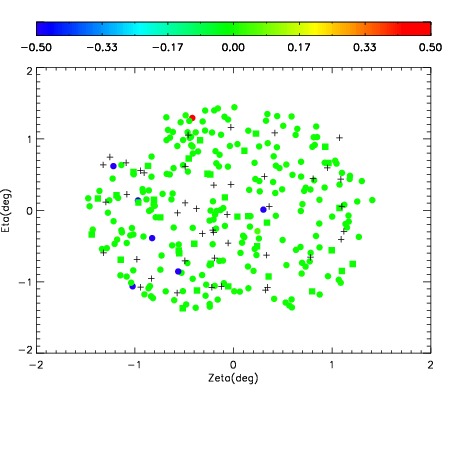
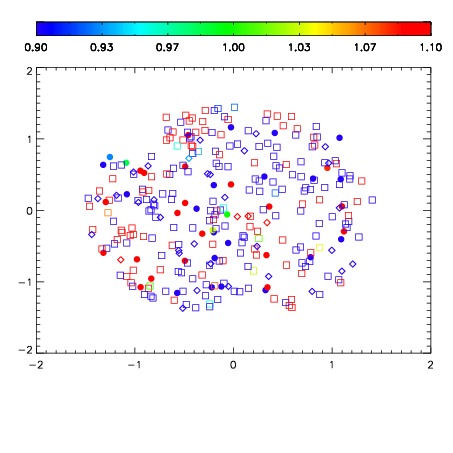
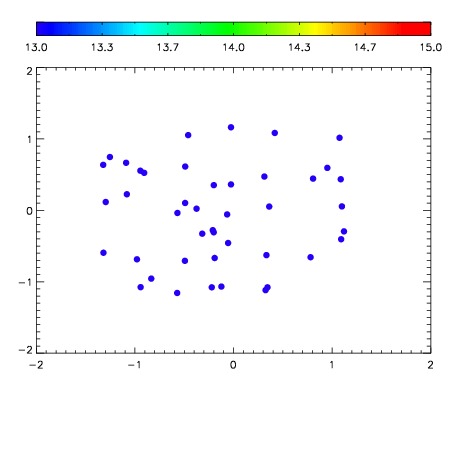

| Frame | Nreads | Zeropoints | Mag plots | Spatial mag deviation | Spatial sky 16325A emission deviations (filled: sky, open: star) | Spatial sky continuum emission | Spatial sky telluric CO2 absorption deviations (filled: H < 10) | |||||||||||||||||||||||
| 0 | 0 |
|
|
|
|
|
|
| IPAIR | NAME | SHIFT | NEWSHIFT | S/N | NAME | SHIFT | NEWSHIFT | S/N |
| 0 | 04050071 | 0.499141 | 0.00000 | 205.702 | 04050076 | 0.00201122 | 0.497130 | 214.372 |
| 1 | 04050074 | 0.494954 | 0.00418702 | 230.809 | 04050073 | 4.22328e-05 | 0.499099 | 229.487 |
| 2 | 04050075 | 0.497615 | 0.00152600 | 223.941 | 04050072 | 0.000719670 | 0.498421 | 220.235 |
| 3 | 04050070 | 0.498984 | 0.000156999 | 205.670 | 04050069 | 0.00000 | 0.499141 | 189.904 |