| Red | Green | Blue | |
| z | 17.64 | ||
| znorm | Inf | ||
| sky | -NaN | -NaN | -Inf |
| S/N | 28.4 | 49.1 | 53.8 |
| S/N(c) | 0.0 | 0.0 | 0.0 |
| SN(E/C) |
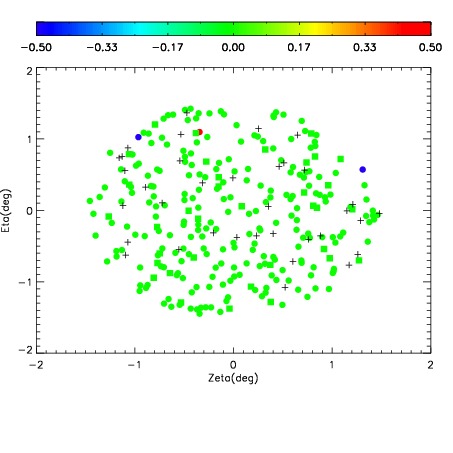
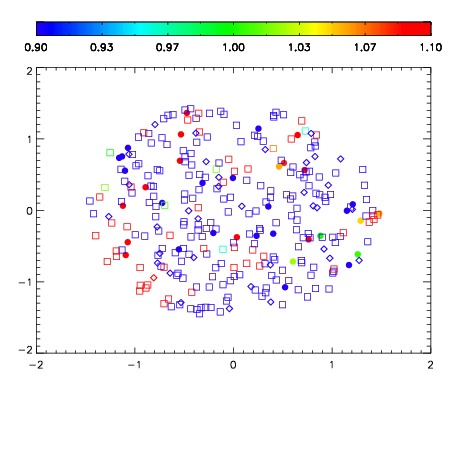


| Frame | Nreads | Zeropoints | Mag plots | Spatial mag deviation | Spatial sky 16325A emission deviations (filled: sky, open: star) | Spatial sky continuum emission | Spatial sky telluric CO2 absorption deviations (filled: H < 10) | |||||||||||||||||||||||
| 0 | 0 |
|
|
|
|
|
|
| IPAIR | NAME | SHIFT | NEWSHIFT | S/N | NAME | SHIFT | NEWSHIFT | S/N |
| 0 | 04040079 | 0.499991 | 0.00000 | 218.560 | 04040072 | -0.000408054 | 0.500399 | 212.854 |
| 1 | 04040075 | 0.496659 | 0.00333199 | 246.538 | 04040073 | -0.00163058 | 0.501622 | 234.853 |
| 2 | 04040074 | 0.496196 | 0.00379500 | 234.654 | 04040069 | 0.00000 | 0.499991 | 233.830 |
| 3 | 04040070 | 0.497170 | 0.00282100 | 227.625 | 04040077 | 0.000484334 | 0.499507 | 220.771 |
| 4 | 04040078 | 0.498452 | 0.00153899 | 222.519 | 04040076 | 0.00381822 | 0.496173 | 218.568 |
| 5 | 04040071 | 0.498023 | 0.00196800 | 214.843 | 04040080 | 0.00315671 | 0.496834 | 169.877 |