| Red | Green | Blue | |
| z | 17.64 | ||
| znorm | Inf | ||
| sky | -Inf | -Inf | -Inf |
| S/N | 20.1 | 36.6 | 40.1 |
| S/N(c) | 0.0 | 0.0 | 0.0 |
| SN(E/C) |
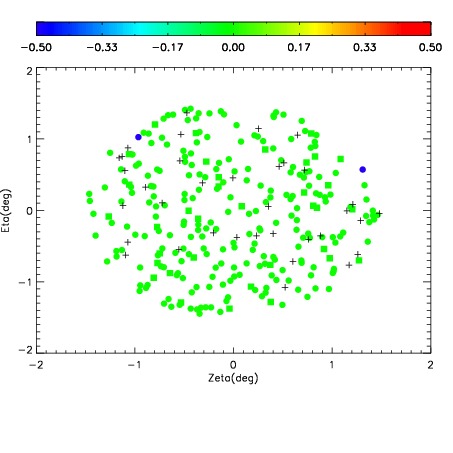
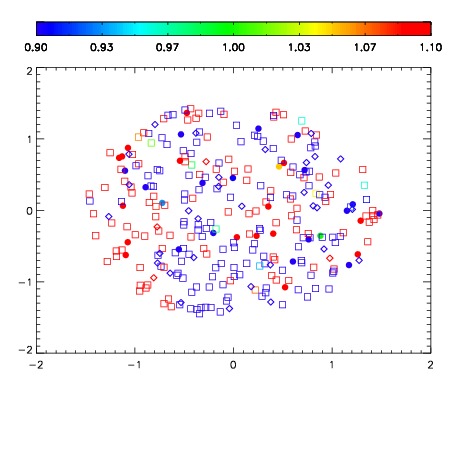
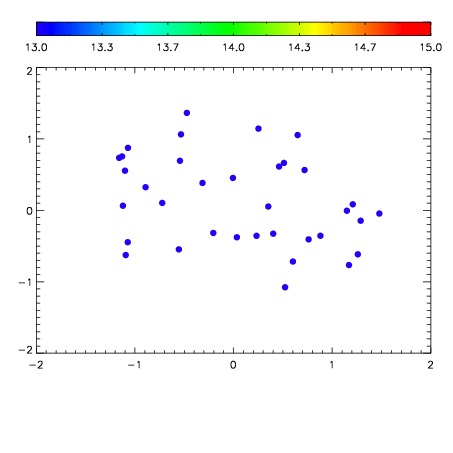

| Frame | Nreads | Zeropoints | Mag plots | Spatial mag deviation | Spatial sky 16325A emission deviations (filled: sky, open: star) | Spatial sky continuum emission | Spatial sky telluric CO2 absorption deviations (filled: H < 10) | |||||||||||||||||||||||
| 0 | 0 |
|
|
|
|
|
|
| IPAIR | NAME | SHIFT | NEWSHIFT | S/N | NAME | SHIFT | NEWSHIFT | S/N |
| 0 | 11720060 | 0.494417 | 0.00000 | 183.749 | 11720062 | -0.00431820 | 0.498735 | 177.042 |
| 1 | 11720061 | 0.494038 | 0.000379026 | 196.490 | 11720055 | 0.00000 | 0.494417 | 195.312 |
| 2 | 11720056 | 0.493041 | 0.00137600 | 192.774 | 11720058 | -0.00198083 | 0.496398 | 194.951 |
| 3 | 11720057 | 0.493200 | 0.00121701 | 186.649 | 11720059 | -0.00229170 | 0.496709 | 182.353 |