| Red | Green | Blue | |
| z | 17.64 | ||
| znorm | Inf | ||
| sky | -Inf | -Inf | -Inf |
| S/N | 9.7 | 17.2 | 21.8 |
| S/N(c) | 0.0 | 0.0 | 0.0 |
| SN(E/C) |

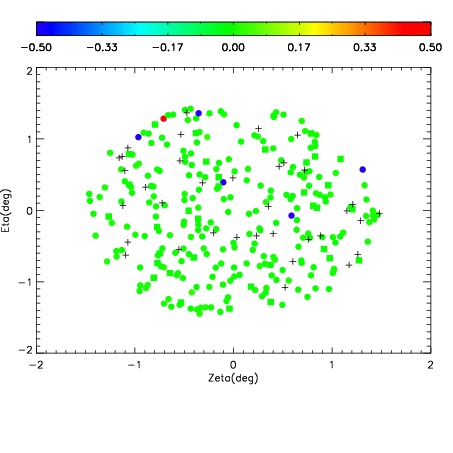
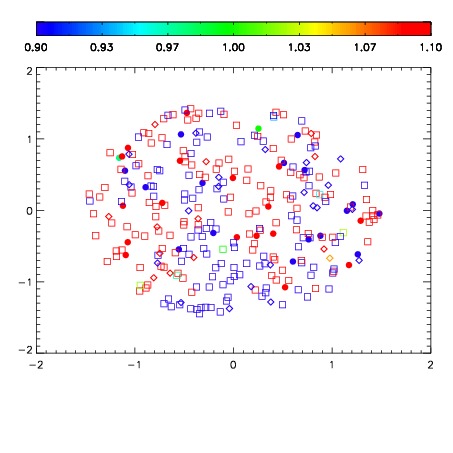
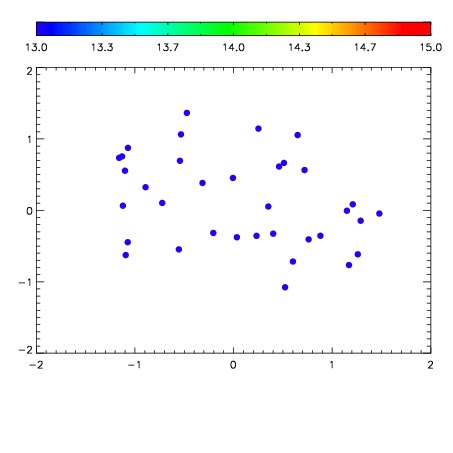

| Frame | Nreads | Zeropoints | Mag plots | Spatial mag deviation | Spatial sky 16325A emission deviations (filled: sky, open: star) | Spatial sky continuum emission | Spatial sky telluric CO2 absorption deviations (filled: H < 10) | |||||||||||||||||||||||
| 0 | 0 |
|
|
|
|
|
|
| IPAIR | NAME | SHIFT | NEWSHIFT | S/N | NAME | SHIFT | NEWSHIFT | S/N |
| 0 | 11970034 | 0.501192 | 0.00000 | 169.464 | 11970033 | 0.00000 | 0.501192 | 169.487 |
| 1 | 11970035 | 0.501045 | 0.000146985 | 144.250 | 11970036 | -0.00351573 | 0.504708 | 137.263 |
| 2 | 11970039 | 0.500864 | 0.000327945 | 118.413 | 11970037 | -0.00320237 | 0.504394 | 136.144 |
| 3 | 11970038 | 0.499872 | 0.00131997 | 109.816 | 11970040 | -0.00226547 | 0.503457 | 134.231 |