| Red | Green | Blue | |
| z | 17.64 | ||
| znorm | Inf | ||
| sky | -NaN | -Inf | -Inf |
| S/N | 21.9 | 37.5 | 41.0 |
| S/N(c) | 0.0 | 0.0 | 0.0 |
| SN(E/C) |
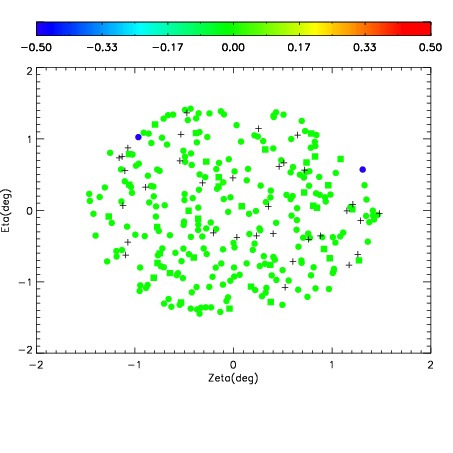
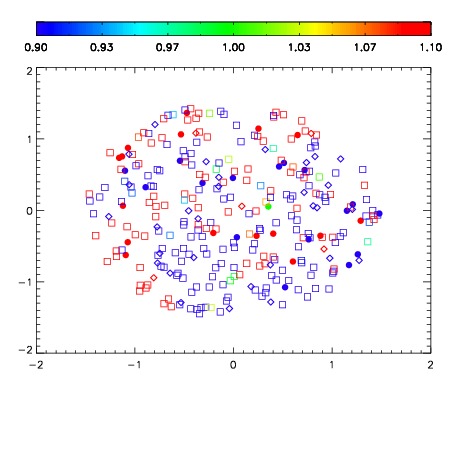
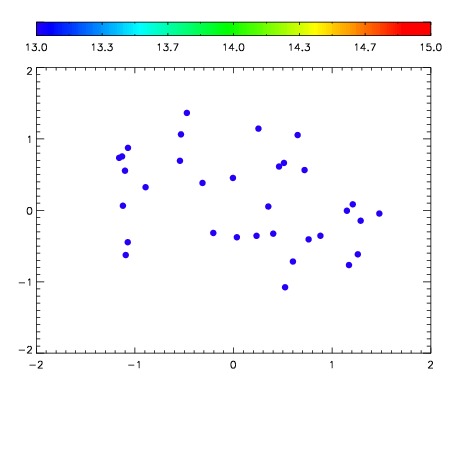

| Frame | Nreads | Zeropoints | Mag plots | Spatial mag deviation | Spatial sky 16325A emission deviations (filled: sky, open: star) | Spatial sky continuum emission | Spatial sky telluric CO2 absorption deviations (filled: H < 10) | |||||||||||||||||||||||
| 0 | 0 |
|
|
|
|
|
|
| IPAIR | NAME | SHIFT | NEWSHIFT | S/N | NAME | SHIFT | NEWSHIFT | S/N |
| 0 | 12240013 | 0.489340 | 0.00000 | 193.464 | 12240014 | -0.00142397 | 0.490764 | 201.089 |
| 1 | 12240016 | 0.487381 | 0.00195900 | 213.668 | 12240018 | -0.00585634 | 0.495196 | 217.777 |
| 2 | 12240017 | 0.487139 | 0.00220102 | 213.629 | 12240015 | -0.00143313 | 0.490773 | 209.409 |
| 3 | 12240012 | 0.489069 | 0.000270993 | 157.867 | 12240011 | 0.00000 | 0.489340 | 160.146 |