| Red | Green | Blue | |
| z | 17.64 | ||
| znorm | Inf | ||
| sky | -Inf | -Inf | -Inf |
| S/N | 20.3 | 39.3 | 43.2 |
| S/N(c) | 0.0 | 0.0 | 0.0 |
| SN(E/C) |
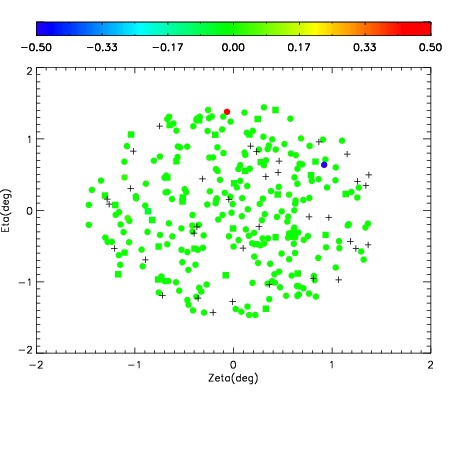

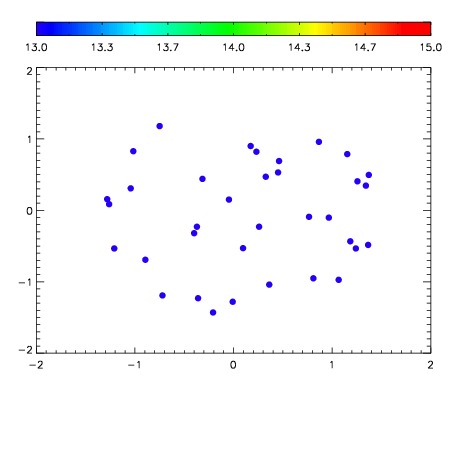

| Frame | Nreads | Zeropoints | Mag plots | Spatial mag deviation | Spatial sky 16325A emission deviations (filled: sky, open: star) | Spatial sky continuum emission | Spatial sky telluric CO2 absorption deviations (filled: H < 10) | |||||||||||||||||||||||
| 0 | 0 |
|
|
|
|
|
|
| IPAIR | NAME | SHIFT | NEWSHIFT | S/N | NAME | SHIFT | NEWSHIFT | S/N |
| 0 | 11110098 | 0.483572 | 0.00000 | 129.105 | 11110100 | -0.00233178 | 0.485904 | 134.204 |
| 1 | 11110106 | 0.476733 | 0.00683901 | 169.896 | 11110104 | -0.00465932 | 0.488231 | 164.141 |
| 2 | 11110105 | 0.476548 | 0.00702402 | 151.551 | 11110107 | -0.00764631 | 0.491218 | 158.637 |
| 3 | 11110109 | 0.477645 | 0.00592700 | 151.112 | 11110108 | -0.00729033 | 0.490862 | 156.640 |
| 4 | 11110101 | 0.479224 | 0.00434801 | 138.774 | 11110103 | -0.00498392 | 0.488556 | 150.371 |
| 5 | 11110097 | 0.483433 | 0.000138998 | 135.304 | 11110099 | -0.00339671 | 0.486969 | 138.186 |
| 6 | 11110102 | 0.478520 | 0.00505200 | 133.909 | 11110096 | 0.00000 | 0.483572 | 135.825 |