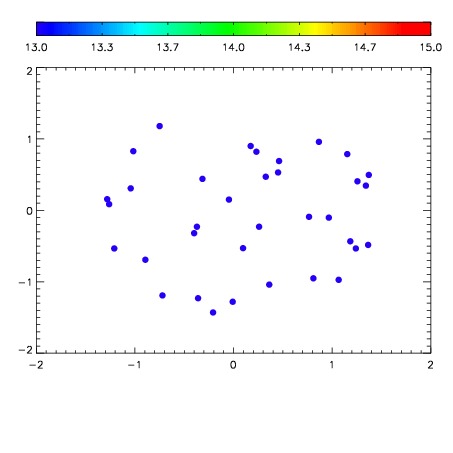
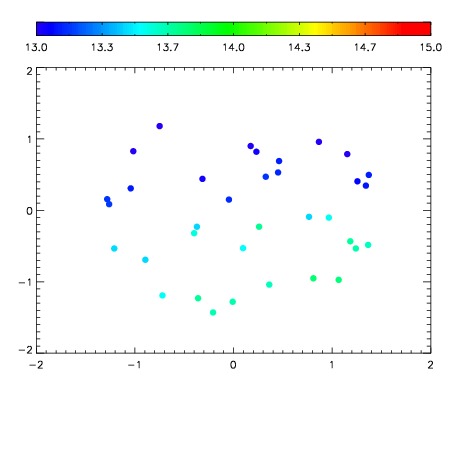
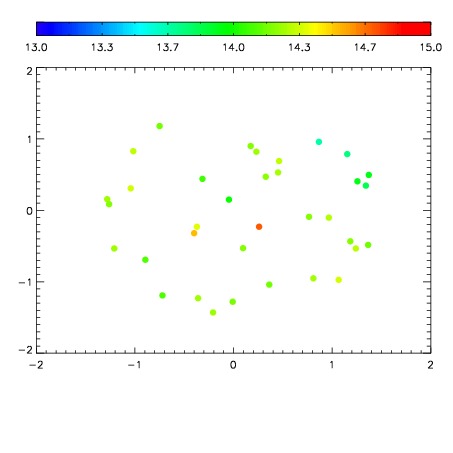
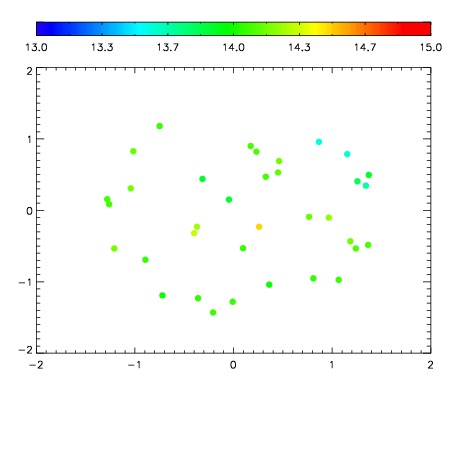
| Frame | Nreads | Zeropoints | Mag plots
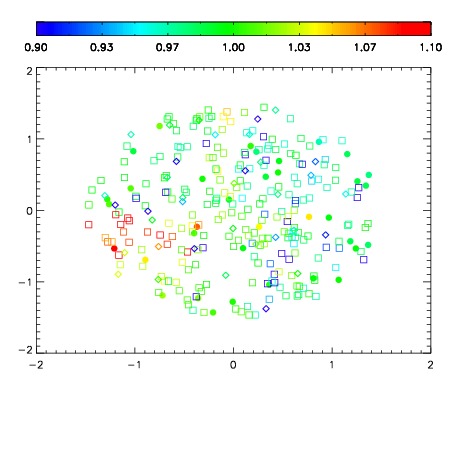
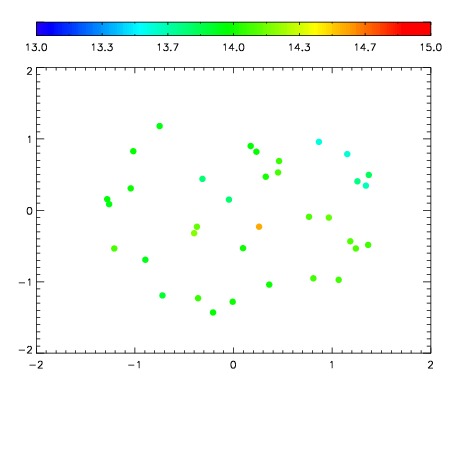
| Spatial mag deviation
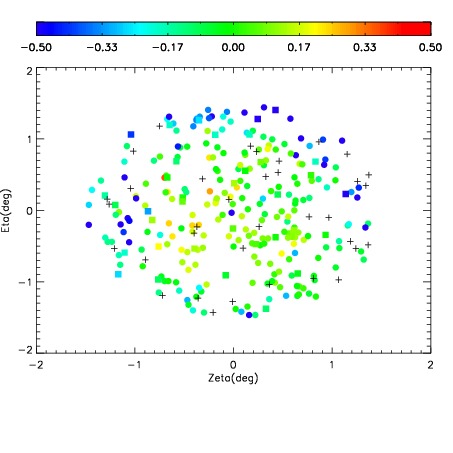
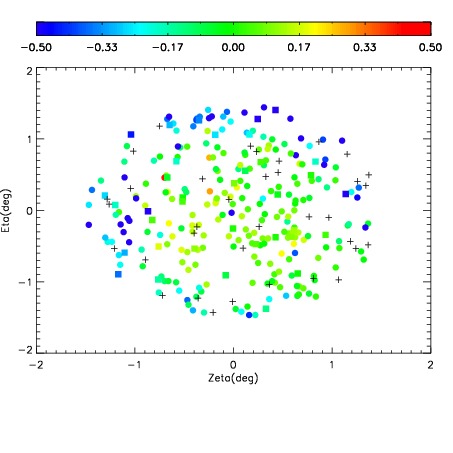
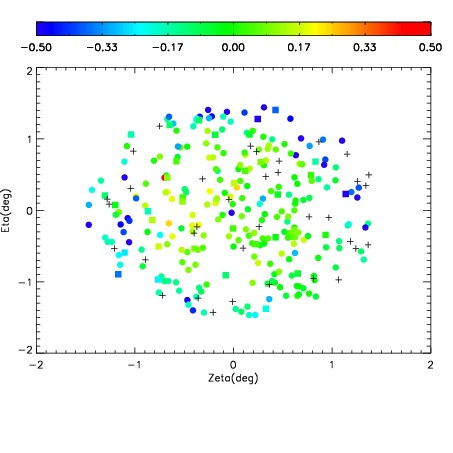
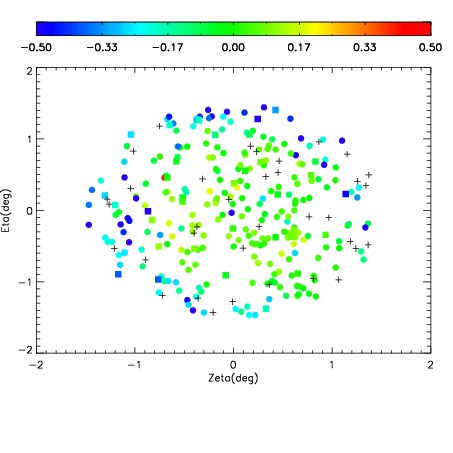
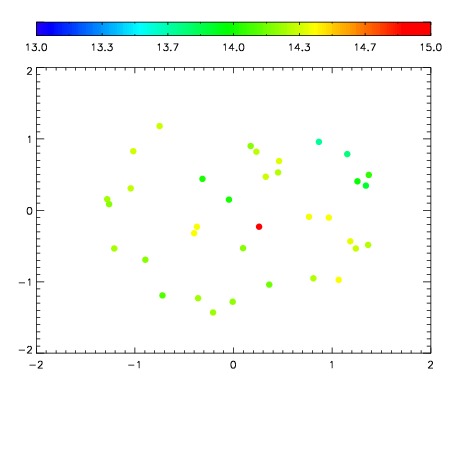
| Spatial sky 16325A emission deviations (filled: sky, open: star)
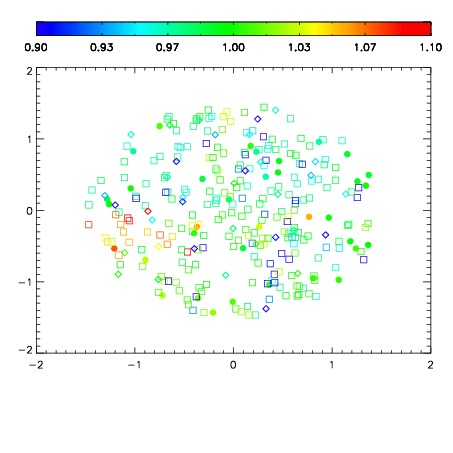
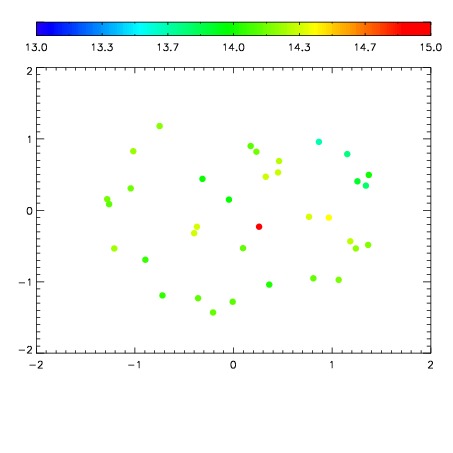
| Spatial sky continuum emission
| Spatial sky telluric CO2 absorption deviations (filled: H < 10)
|
| 11420053
| 47
| | Red | Green | Blue
| | z | | 18.34
| | znorm | | 14.16
| | sky | 12.9 | 12.8 | 12.7
| | S/N | 8.3 | 13.1 | 14.5
| | S/N(c) | 6.7 | 11.9 | 14.7
| | SN(E/C) 0.65
|
| 
| 
| 
| 
| 
|
| 11420054
| 47
| | Red | Green | Blue
| | z | | 18.76
| | znorm | | 14.58
| | sky | 13.5 | 13.4 | 13.2
| | S/N | 11.8 | 19.4 | 19.5
| | S/N(c) | 9.9 | 16.8 | 19.1
| | SN(E/C) 0.57
|
| 
| 
| 
| 
| 
|
| 11420055
| 47
| | Red | Green | Blue
| | z | | 18.13
| | znorm | | 13.95
| | sky | 12.5 | 12.4 | 12.4
| | S/N | 6.5 | 10.1 | 12.0
| | S/N(c) | 5.6 | 9.3 | 11.5
| | SN(E/C) 0.73
|
| 
| 
| 
| 
| 
|
| 11420056
| 47
| | Red | Green | Blue
| | z | | 18.95
| | znorm | | 14.77
| | sky | 14.4 | 14.2 | 14.2
| | S/N | 14.0 | 22.5 | 24.8
| | S/N(c) | 12.1 | 20.7 | 23.3
| | SN(E/C) 0.52
|
| 
| 
| 
| 
| 
|
| 11420057
| 47
| | Red | Green | Blue
| | z | | 18.93
| | znorm | | 14.75
| | sky | 14.3 | 14.1 | 14.0
| | S/N | 13.7 | 22.3 | 24.2
| | S/N(c) | 12.0 | 20.2 | 22.8
| | SN(E/C) 0.53
|
| 
| 
| 
| 
| 
|
| 11420058
| 47
| | Red | Green | Blue
| | z | | 18.91
| | znorm | | 14.73
| | sky | 14.3 | 14.3 | 14.1
| | S/N | 13.5 | 22.3 | 23.7
| | S/N(c) | 11.9 | 20.5 | 22.6
| | SN(E/C) 0.52
|
| 
| 
| 
| 
| 
|
| 11420059
| 47
| | Red | Green | Blue
| | z | | 18.95
| | znorm | | 14.77
| | sky | 14.2 | 14.2 | 14.1
| | S/N | 13.7 | 22.6 | 24.2
| | S/N(c) | 12.1 | 20.8 | 23.1
| | SN(E/C) 0.53
|
| 
| 
| 
| 
| 
|
| 11420060
| 47
| | Red | Green | Blue
| | z | | 18.94
| | znorm | | 14.76
| | sky | 14.2 | 14.0 | 13.9
| | S/N | 13.9 | 21.9 | 24.1
| | S/N(c) | 12.1 | 20.5 | 22.9
| | SN(E/C) 0.52
|
| 
| 
| 
| 
| 
|