| Red | Green | Blue | |
| z | 17.64 | ||
| znorm | Inf | ||
| sky | -NaN | -NaN | -Inf |
| S/N | 21.2 | 36.2 | 40.5 |
| S/N(c) | 0.0 | 0.0 | 0.0 |
| SN(E/C) |
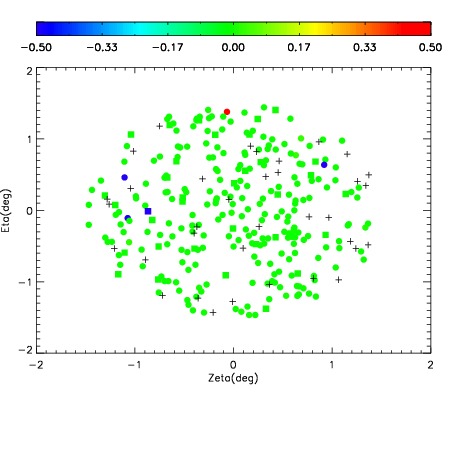
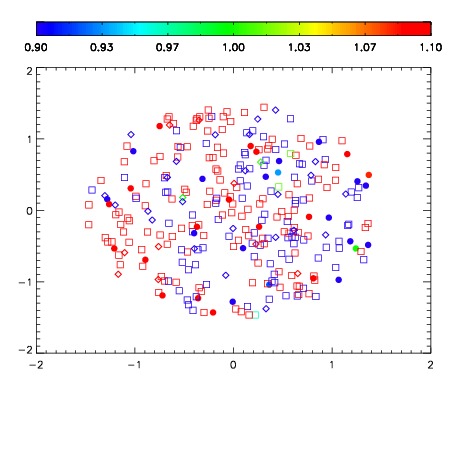
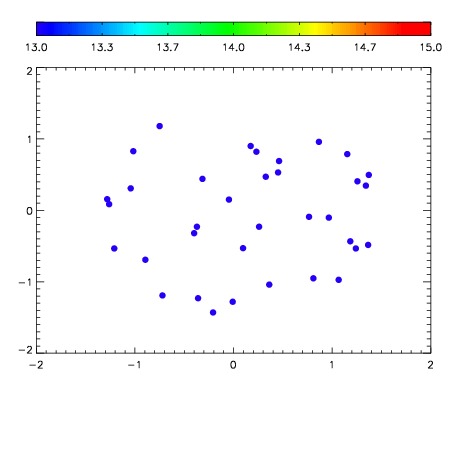

| Frame | Nreads | Zeropoints | Mag plots | Spatial mag deviation | Spatial sky 16325A emission deviations (filled: sky, open: star) | Spatial sky continuum emission | Spatial sky telluric CO2 absorption deviations (filled: H < 10) | |||||||||||||||||||||||
| 0 | 0 |
|
|
|
|
|
|
| IPAIR | NAME | SHIFT | NEWSHIFT | S/N | NAME | SHIFT | NEWSHIFT | S/N |
| 0 | 11420055 | 0.479631 | 0.00000 | 130.808 | 11420053 | 0.00000 | 0.479631 | 145.227 |
| 1 | 11420059 | 0.478277 | 0.00135401 | 186.984 | 11420056 | -0.00198616 | 0.481617 | 191.259 |
| 2 | 11420058 | 0.477846 | 0.00178501 | 185.609 | 11420057 | -0.00249595 | 0.482127 | 188.587 |
| 3 | 11420054 | 0.479398 | 0.000232995 | 177.595 | 11420060 | -0.00495122 | 0.484582 | 183.293 |