| Red | Green | Blue | |
| z | 17.64 | ||
| znorm | Inf | ||
| sky | -Inf | -Inf | -Inf |
| S/N | 21.8 | 39.3 | 43.7 |
| S/N(c) | 0.0 | 0.0 | 0.0 |
| SN(E/C) |
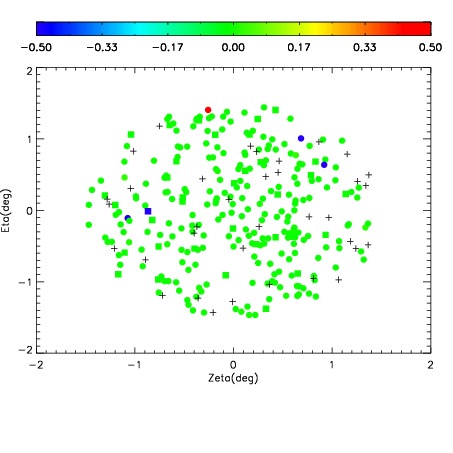

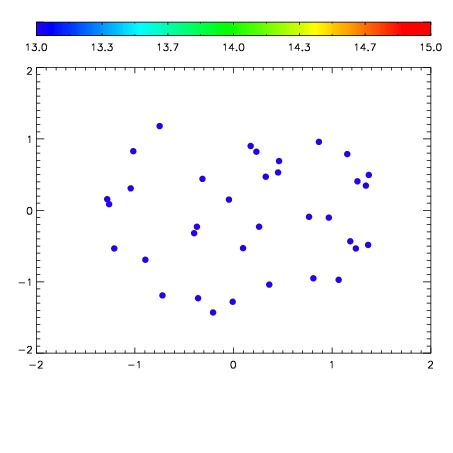

| Frame | Nreads | Zeropoints | Mag plots | Spatial mag deviation | Spatial sky 16325A emission deviations (filled: sky, open: star) | Spatial sky continuum emission | Spatial sky telluric CO2 absorption deviations (filled: H < 10) | |||||||||||||||||||||||
| 0 | 0 |
|
|
|
|
|
|
| IPAIR | NAME | SHIFT | NEWSHIFT | S/N | NAME | SHIFT | NEWSHIFT | S/N |
| 0 | 11640063 | 0.490954 | 0.00000 | 185.103 | 11640061 | 0.00000 | 0.490954 | 172.119 |
| 1 | 11640066 | 0.489775 | 0.00117901 | 190.225 | 11640064 | -0.00275451 | 0.493709 | 185.861 |
| 2 | 11640062 | 0.489990 | 0.000964016 | 189.508 | 11640065 | -0.00178732 | 0.492741 | 182.519 |
| 3 | 11640067 | 0.489526 | 0.00142801 | 188.345 | 11640068 | -0.00287790 | 0.493832 | 181.506 |