| Red | Green | Blue | |
| z | 17.64 | ||
| znorm | Inf | ||
| sky | -Inf | -Inf | -Inf |
| S/N | 32.6 | 58.1 | 62.9 |
| S/N(c) | 0.0 | 0.0 | 0.0 |
| SN(E/C) |
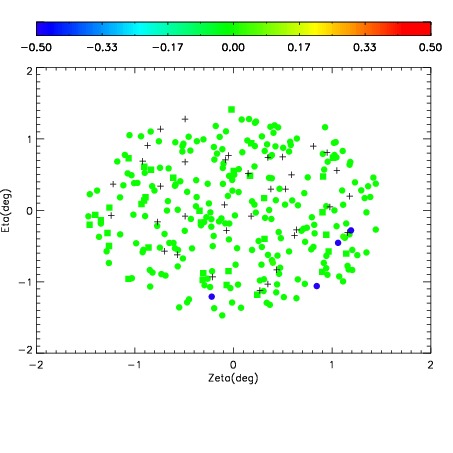
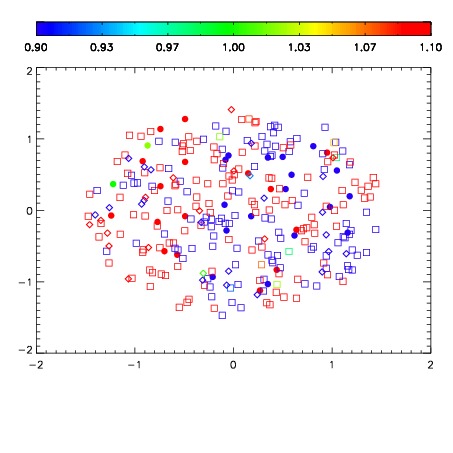
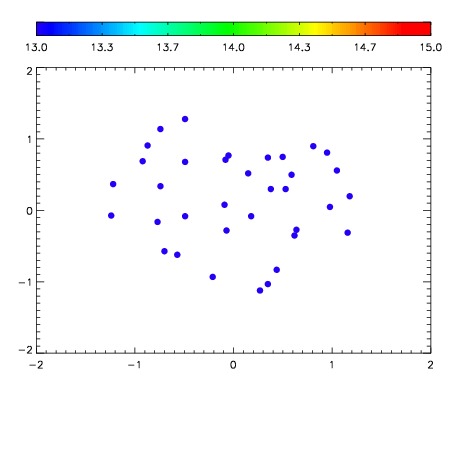

| Frame | Nreads | Zeropoints | Mag plots | Spatial mag deviation | Spatial sky 16325A emission deviations (filled: sky, open: star) | Spatial sky continuum emission | Spatial sky telluric CO2 absorption deviations (filled: H < 10) | |||||||||||||||||||||||
| 0 | 0 |
|
|
|
|
|
|
| IPAIR | NAME | SHIFT | NEWSHIFT | S/N | NAME | SHIFT | NEWSHIFT | S/N |
| 0 | 11140100 | 0.485524 | 0.00000 | 231.038 | 11140101 | 0.000267213 | 0.485257 | 232.745 |
| 1 | 11140104 | 0.484086 | 0.00143799 | 235.492 | 11140102 | 0.00100802 | 0.484516 | 236.388 |
| 2 | 11140107 | 0.481558 | 0.00396600 | 234.573 | 11140106 | -0.00253890 | 0.488063 | 235.366 |
| 3 | 11140103 | 0.483517 | 0.00200701 | 233.464 | 11140105 | -0.00292254 | 0.488447 | 234.293 |
| 4 | 11140108 | 0.482079 | 0.00344500 | 229.533 | 11140109 | -0.00237484 | 0.487899 | 228.369 |
| 5 | 11140099 | 0.484905 | 0.000618994 | 228.176 | 11140098 | 0.00000 | 0.485524 | 227.830 |