| Red | Green | Blue | |
| z | 17.64 | ||
| znorm | Inf | ||
| sky | -Inf | -Inf | -Inf |
| S/N | 26.0 | 46.0 | 49.0 |
| S/N(c) | 0.0 | 0.0 | 0.0 |
| SN(E/C) |
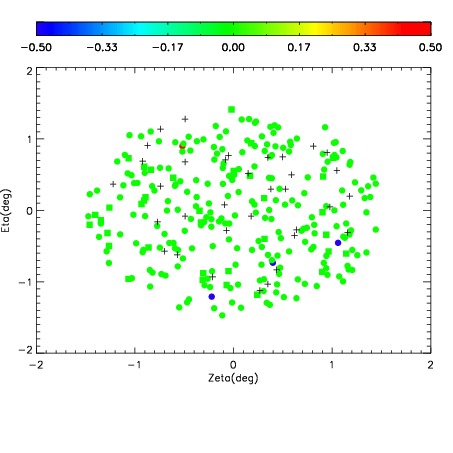
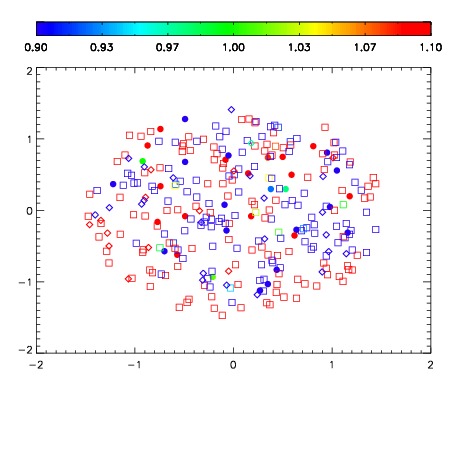
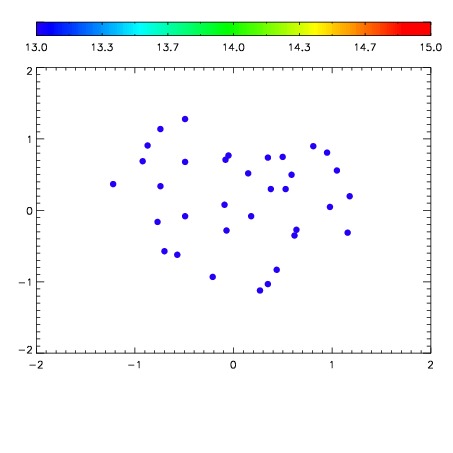

| Frame | Nreads | Zeropoints | Mag plots | Spatial mag deviation | Spatial sky 16325A emission deviations (filled: sky, open: star) | Spatial sky continuum emission | Spatial sky telluric CO2 absorption deviations (filled: H < 10) | |||||||||||||||||||||||
| 0 | 0 |
|
|
|
|
|
|
| IPAIR | NAME | SHIFT | NEWSHIFT | S/N | NAME | SHIFT | NEWSHIFT | S/N |
| 0 | 11370022 | 0.477832 | 0.00000 | 211.336 | 11370023 | -0.00244498 | 0.480277 | 216.564 |
| 1 | 11370021 | 0.477614 | 0.000218004 | 215.565 | 11370024 | -0.00237356 | 0.480206 | 217.212 |
| 2 | 11370025 | 0.476982 | 0.000849992 | 210.711 | 11370020 | 0.00000 | 0.477832 | 206.802 |
| 3 | 11370026 | 0.477794 | 3.79980e-05 | 205.149 | 11370027 | -0.000671456 | 0.478503 | 195.882 |