| Red | Green | Blue | |
| z | 17.64 | ||
| znorm | Inf | ||
| sky | -Inf | -Inf | -Inf |
| S/N | 13.6 | 23.5 | 27.3 |
| S/N(c) | 0.0 | 0.0 | 0.0 |
| SN(E/C) |


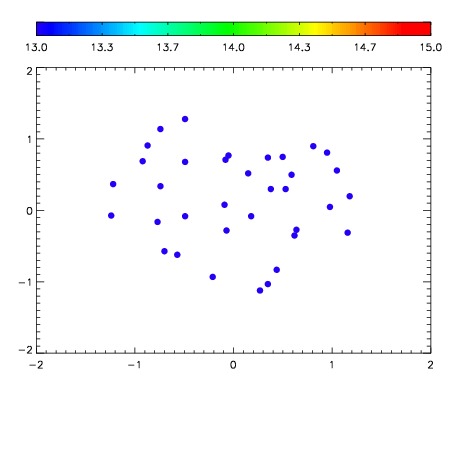

| Frame | Nreads | Zeropoints | Mag plots | Spatial mag deviation | Spatial sky 16325A emission deviations (filled: sky, open: star) | Spatial sky continuum emission | Spatial sky telluric CO2 absorption deviations (filled: H < 10) | |||||||||||||||||||||||
| 0 | 0 |
|
|
|
|
|
|
| IPAIR | NAME | SHIFT | NEWSHIFT | S/N | NAME | SHIFT | NEWSHIFT | S/N |
| 0 | 11420069 | 0.482341 | 0.00000 | 54.9645 | 11420071 | -0.00133791 | 0.483679 | 36.4408 |
| 1 | 11420065 | 0.480512 | 0.00182900 | 191.881 | 11420064 | 0.00000 | 0.482341 | 198.868 |
| 2 | 11420066 | 0.481150 | 0.00119099 | 180.022 | 11420067 | -0.00295907 | 0.485300 | 104.113 |
| 3 | 11420070 | 0.482186 | 0.000155002 | 60.6730 | 11420068 | -0.00265117 | 0.484992 | 45.2079 |