| Red | Green | Blue | |
| z | 17.64 | ||
| znorm | Inf | ||
| sky | -Inf | -Inf | -Inf |
| S/N | 22.2 | 38.5 | 45.1 |
| S/N(c) | 0.0 | 0.0 | 0.0 |
| SN(E/C) |
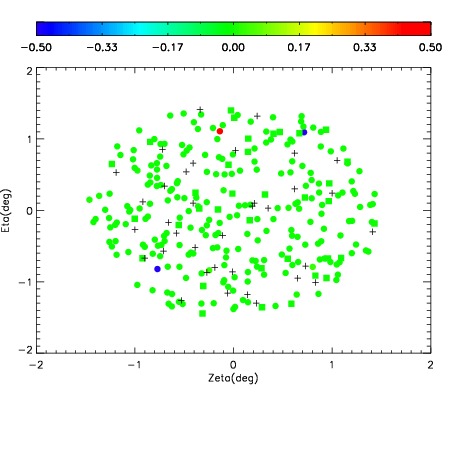
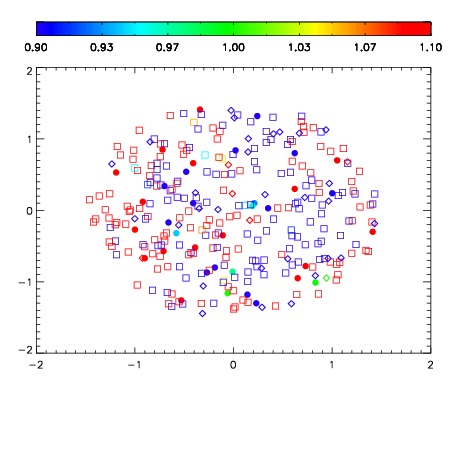
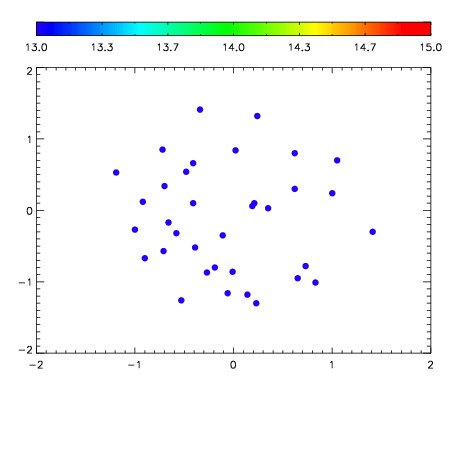

| Frame | Nreads | Zeropoints | Mag plots | Spatial mag deviation | Spatial sky 16325A emission deviations (filled: sky, open: star) | Spatial sky continuum emission | Spatial sky telluric CO2 absorption deviations (filled: H < 10) | |||||||||||||||||||||||
| 0 | 0 |
|
|
|
|
|
|
| IPAIR | NAME | SHIFT | NEWSHIFT | S/N | NAME | SHIFT | NEWSHIFT | S/N |
| 0 | 11670075 | 0.489690 | 0.00000 | 190.648 | 11670076 | -0.00379971 | 0.493490 | 193.586 |
| 1 | 11670079 | 0.489495 | 0.000194997 | 200.049 | 11670080 | -0.00252621 | 0.492216 | 195.164 |
| 2 | 11670074 | 0.488980 | 0.000710011 | 190.779 | 11670073 | 0.00000 | 0.489690 | 194.346 |
| 3 | 11670078 | 0.489327 | 0.000362992 | 184.208 | 11670077 | -0.00380024 | 0.493490 | 193.309 |