| Red | Green | Blue | |
| z | 17.64 | ||
| znorm | Inf | ||
| sky | -NaN | -Inf | -Inf |
| S/N | 23.7 | 42.9 | 47.8 |
| S/N(c) | 0.0 | 0.0 | 0.0 |
| SN(E/C) |
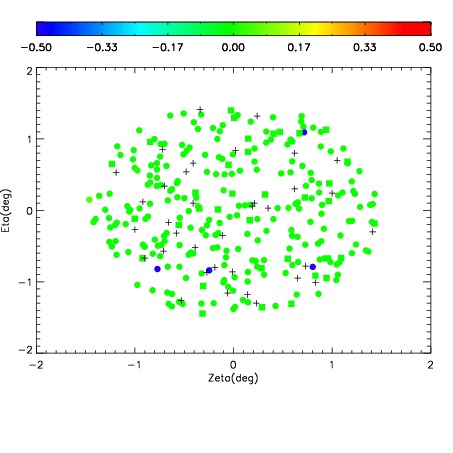
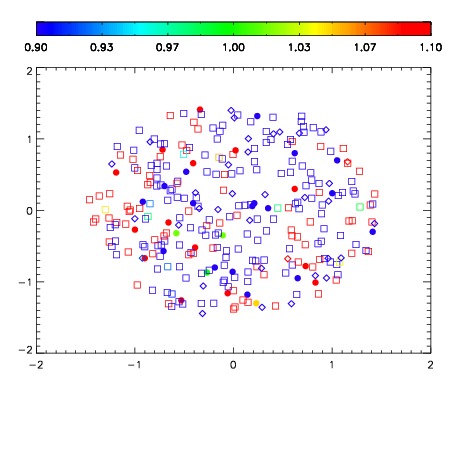
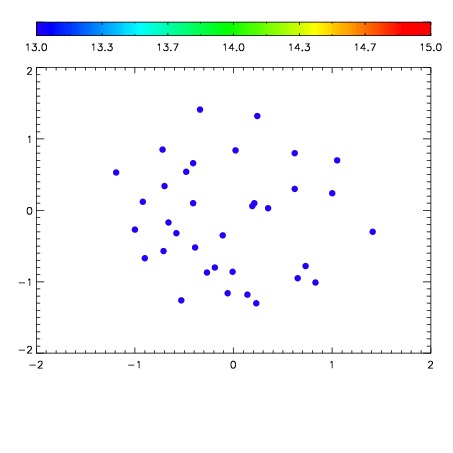

| Frame | Nreads | Zeropoints | Mag plots | Spatial mag deviation | Spatial sky 16325A emission deviations (filled: sky, open: star) | Spatial sky continuum emission | Spatial sky telluric CO2 absorption deviations (filled: H < 10) | |||||||||||||||||||||||
| 0 | 0 |
|
|
|
|
|
|
| IPAIR | NAME | SHIFT | NEWSHIFT | S/N | NAME | SHIFT | NEWSHIFT | S/N |
| 0 | 11950053 | 0.502886 | 0.00000 | 210.397 | 11950050 | -0.000654768 | 0.503541 | 212.934 |
| 1 | 11950049 | 0.499363 | 0.00352299 | 217.442 | 11950054 | 0.00126187 | 0.501624 | 219.021 |
| 2 | 11950048 | 0.499308 | 0.00357801 | 213.544 | 11950051 | 0.000374030 | 0.502512 | 218.317 |
| 3 | 11950052 | 0.501983 | 0.000903010 | 209.581 | 11950047 | 0.00000 | 0.502886 | 208.233 |