| Red | Green | Blue | |
| z | 17.64 | ||
| znorm | Inf | ||
| sky | -Inf | -Inf | -Inf |
| S/N | 21.5 | 38.4 | 41.3 |
| S/N(c) | 0.0 | 0.0 | 0.0 |
| SN(E/C) |
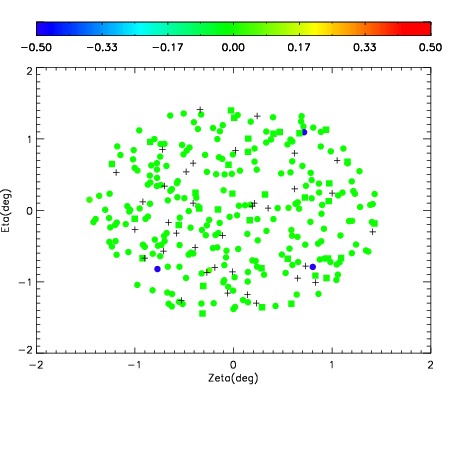
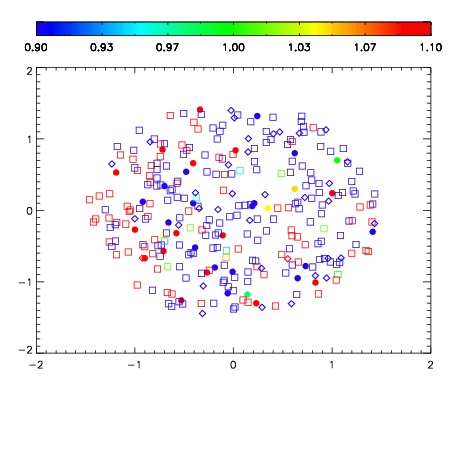
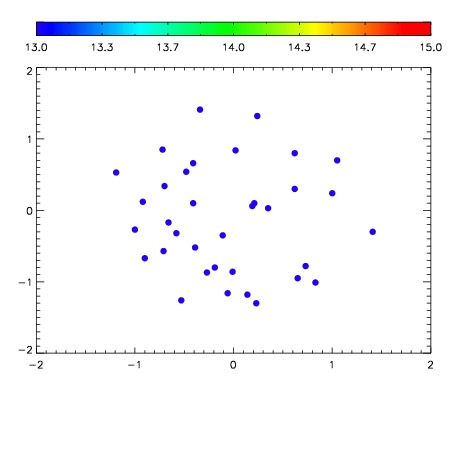

| Frame | Nreads | Zeropoints | Mag plots | Spatial mag deviation | Spatial sky 16325A emission deviations (filled: sky, open: star) | Spatial sky continuum emission | Spatial sky telluric CO2 absorption deviations (filled: H < 10) | |||||||||||||||||||||||
| 0 | 0 |
|
|
|
|
|
|
| IPAIR | NAME | SHIFT | NEWSHIFT | S/N | NAME | SHIFT | NEWSHIFT | S/N |
| 0 | 12010023 | 0.501773 | 0.00000 | 209.491 | 12010021 | -0.00312818 | 0.504901 | 215.891 |
| 1 | 12010024 | 0.501306 | 0.000467002 | 205.986 | 12010022 | -0.00326495 | 0.505038 | 202.573 |
| 2 | 12010019 | 0.500457 | 0.00131601 | 203.907 | 12010025 | -0.000651074 | 0.502424 | 195.989 |
| 3 | 12010020 | 0.500058 | 0.00171500 | 199.305 | 12010018 | 0.00000 | 0.501773 | 191.970 |