| Red | Green | Blue | |
| z | 17.64 | ||
| znorm | Inf | ||
| sky | -Inf | -Inf | -Inf |
| S/N | 29.0 | 50.0 | 53.6 |
| S/N(c) | 0.0 | 0.0 | 0.0 |
| SN(E/C) |
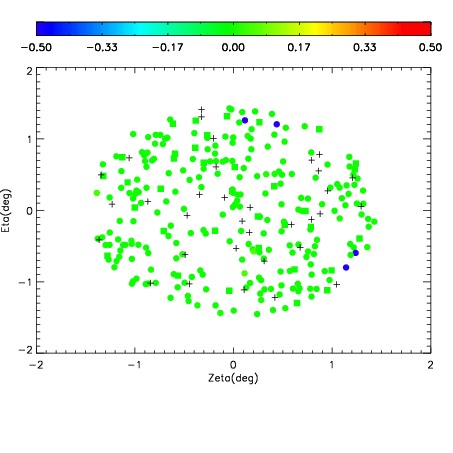
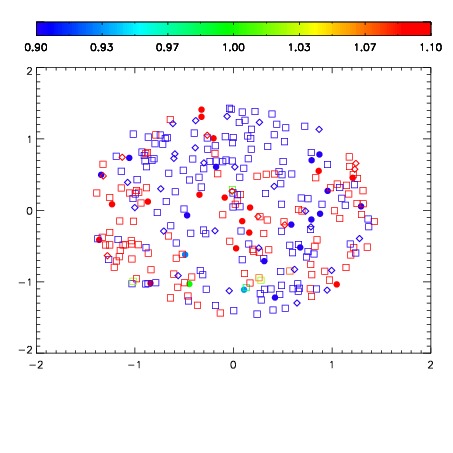
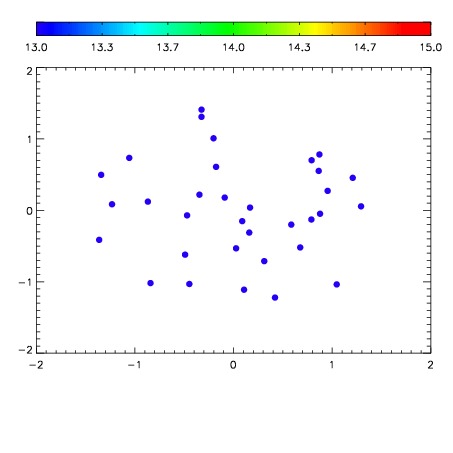

| Frame | Nreads | Zeropoints | Mag plots | Spatial mag deviation | Spatial sky 16325A emission deviations (filled: sky, open: star) | Spatial sky continuum emission | Spatial sky telluric CO2 absorption deviations (filled: H < 10) | |||||||||||||||||||||||
| 0 | 0 |
|
|
|
|
|
|
| IPAIR | NAME | SHIFT | NEWSHIFT | S/N | NAME | SHIFT | NEWSHIFT | S/N |
| 0 | 04860015 | 0.494934 | 0.00000 | 182.138 | 04860017 | 0.00118791 | 0.493746 | 182.569 |
| 1 | 04860014 | 0.492071 | 0.00286299 | 181.566 | 04860020 | 0.000978607 | 0.493955 | 179.237 |
| 2 | 04860018 | 0.492968 | 0.00196600 | 179.966 | 04860016 | 0.00372369 | 0.491210 | 178.458 |
| 3 | 04860019 | 0.494251 | 0.000682980 | 178.986 | 04860013 | 0.00000 | 0.494934 | 171.365 |