| Red | Green | Blue | |
| z | 17.64 | ||
| znorm | Inf | ||
| sky | -NaN | -Inf | -Inf |
| S/N | 20.9 | 39.5 | 42.7 |
| S/N(c) | 0.0 | 0.0 | 0.0 |
| SN(E/C) |
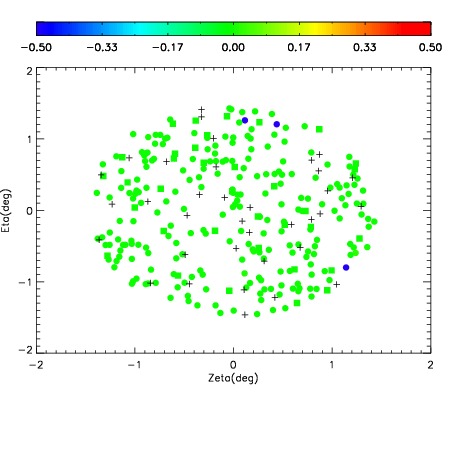

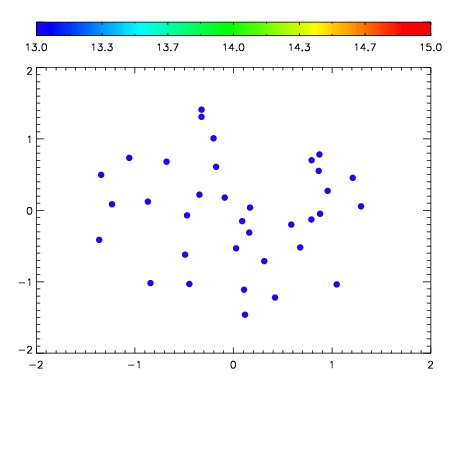

| Frame | Nreads | Zeropoints | Mag plots | Spatial mag deviation | Spatial sky 16325A emission deviations (filled: sky, open: star) | Spatial sky continuum emission | Spatial sky telluric CO2 absorption deviations (filled: H < 10) | |||||||||||||||||||||||
| 0 | 0 |
|
|
|
|
|
|
| IPAIR | NAME | SHIFT | NEWSHIFT | S/N | NAME | SHIFT | NEWSHIFT | S/N |
| 0 | 07890054 | 0.472590 | 0.00000 | 168.127 | 07890051 | 0.000291776 | 0.472298 | 165.806 |
| 1 | 07890053 | 0.472403 | 0.000187010 | 169.085 | 07890052 | -0.000761555 | 0.473352 | 167.980 |
| 2 | 07890050 | 0.472264 | 0.000326008 | 149.951 | 07890055 | 0.00251329 | 0.470077 | 161.200 |
| 3 | 07890049 | 0.472525 | 6.49989e-05 | 130.238 | 07890048 | 0.00000 | 0.472590 | 122.976 |