| Red | Green | Blue | |
| z | 17.64 | ||
| znorm | Inf | ||
| sky | -Inf | -NaN | -Inf |
| S/N | 32.0 | 56.2 | 64.1 |
| S/N(c) | 0.0 | 0.0 | 0.0 |
| SN(E/C) |
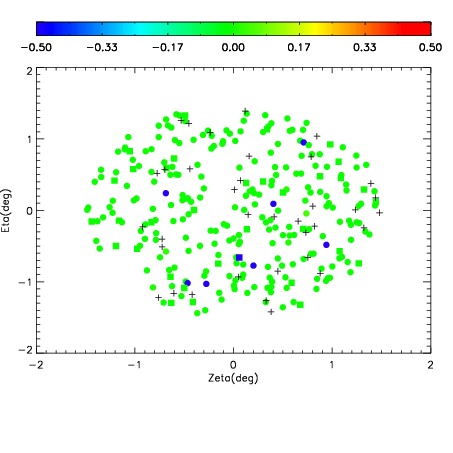
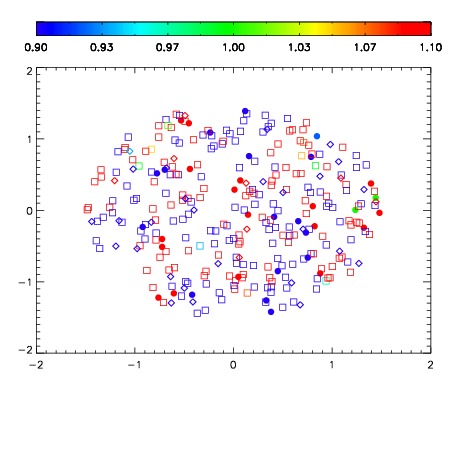
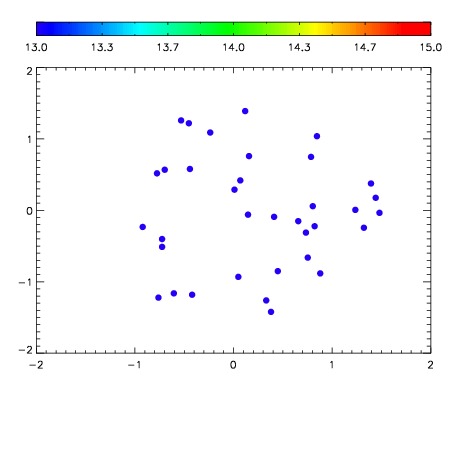

| Frame | Nreads | Zeropoints | Mag plots | Spatial mag deviation | Spatial sky 16325A emission deviations (filled: sky, open: star) | Spatial sky continuum emission | Spatial sky telluric CO2 absorption deviations (filled: H < 10) | |||||||||||||||||||||||
| 0 | 0 |
|
|
|
|
|
|
| IPAIR | NAME | SHIFT | NEWSHIFT | S/N | NAME | SHIFT | NEWSHIFT | S/N |
| 0 | 11130098 | 0.485386 | 0.00000 | 226.608 | 11130100 | -0.000156696 | 0.485543 | 223.545 |
| 1 | 11130097 | 0.484268 | 0.00111800 | 229.941 | 11130099 | -0.000183477 | 0.485569 | 224.646 |
| 2 | 11130102 | 0.484102 | 0.00128400 | 229.245 | 11130103 | -0.00219312 | 0.487579 | 224.273 |
| 3 | 11130101 | 0.483830 | 0.00155601 | 222.607 | 11130107 | -0.00105023 | 0.486436 | 218.499 |
| 4 | 11130106 | 0.483742 | 0.00164402 | 221.140 | 11130096 | 0.00000 | 0.485386 | 217.462 |
| 5 | 11130105 | 0.483059 | 0.00232702 | 210.716 | 11130108 | -0.00122681 | 0.486613 | 214.619 |
| 6 | 11130110 | 0.483954 | 0.00143200 | 205.914 | 11130104 | -0.00188076 | 0.487267 | 213.958 |
| 7 | 11130109 | 0.483201 | 0.00218502 | 201.698 | 11130111 | -0.00137966 | 0.486766 | 193.697 |