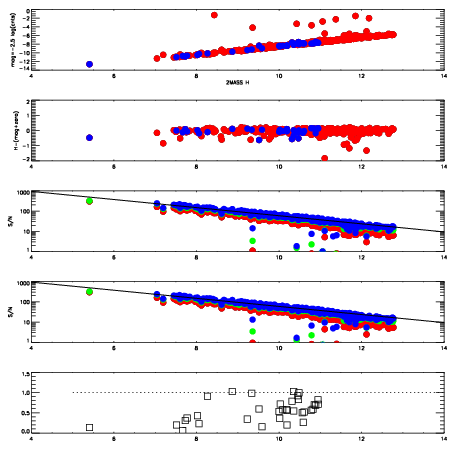
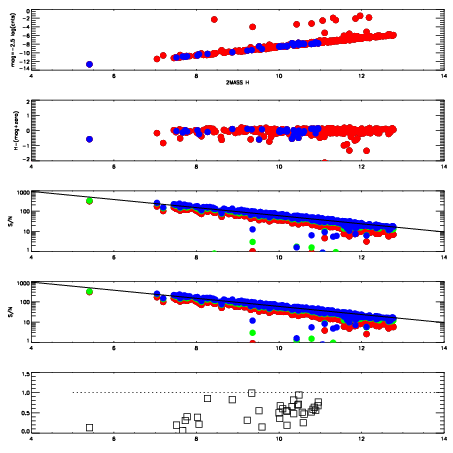
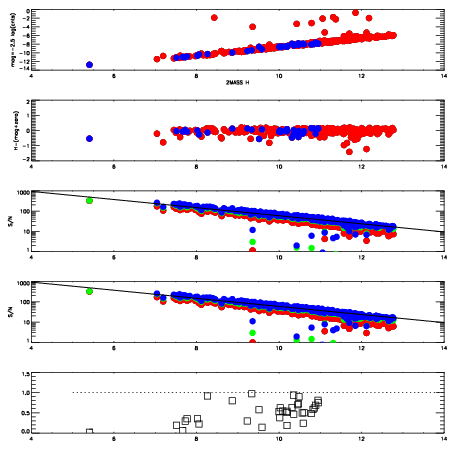
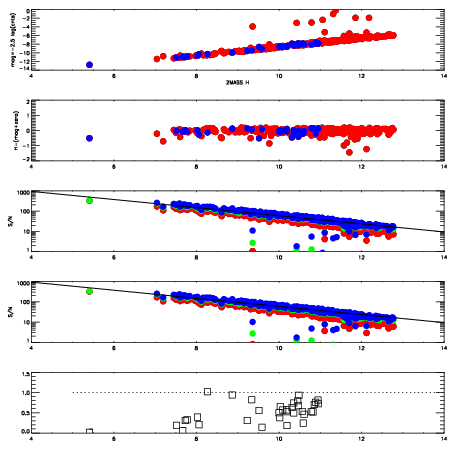
| Frame | Nreads | Zeropoints | Mag plots
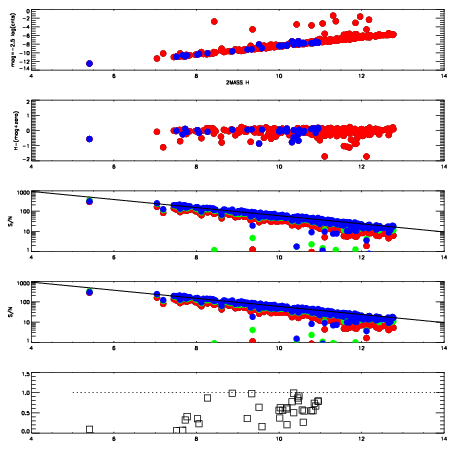
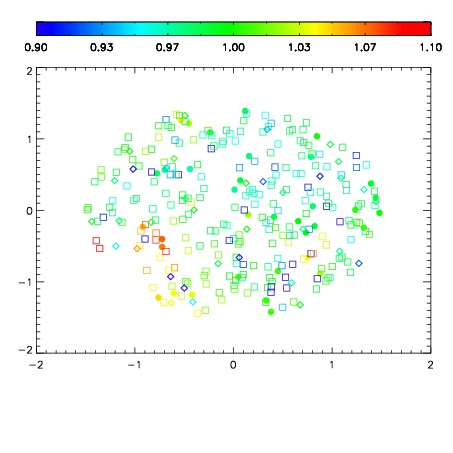
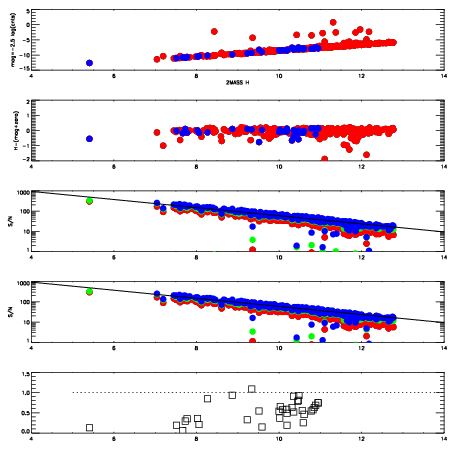
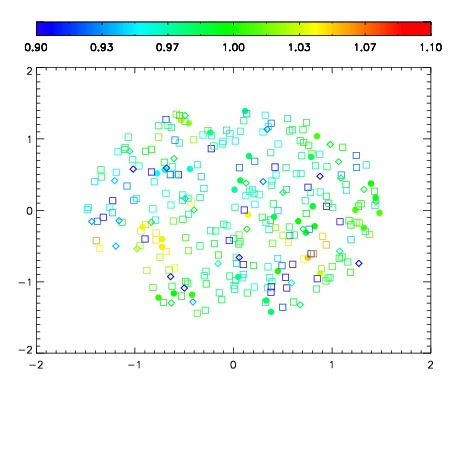
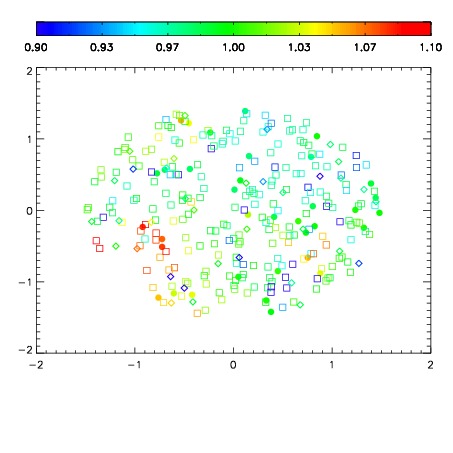
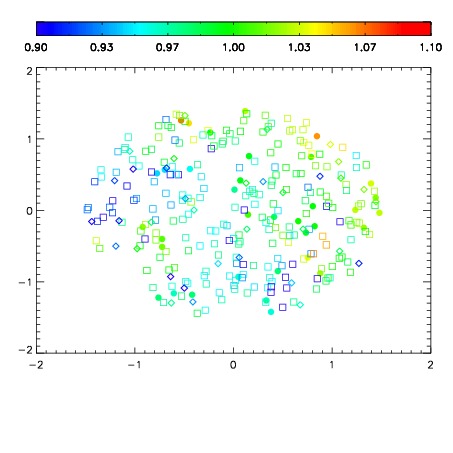
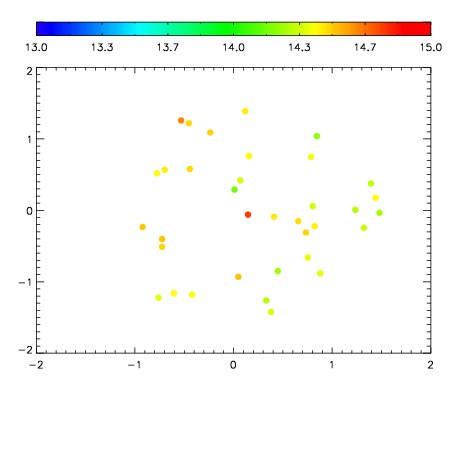
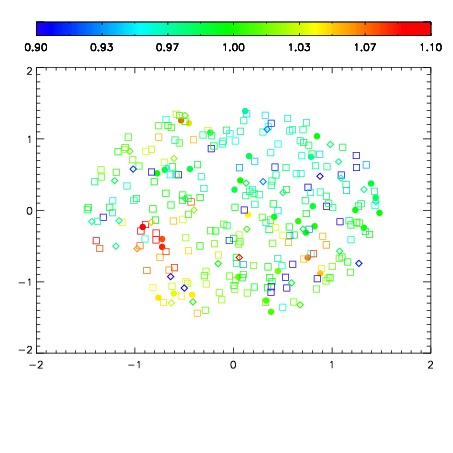
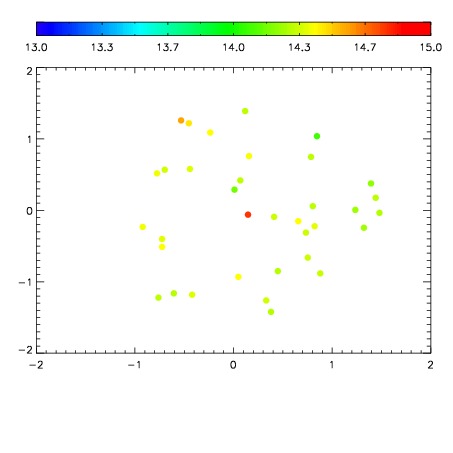
| Spatial mag deviation
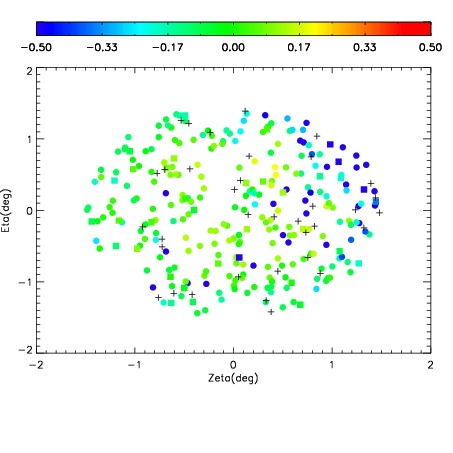
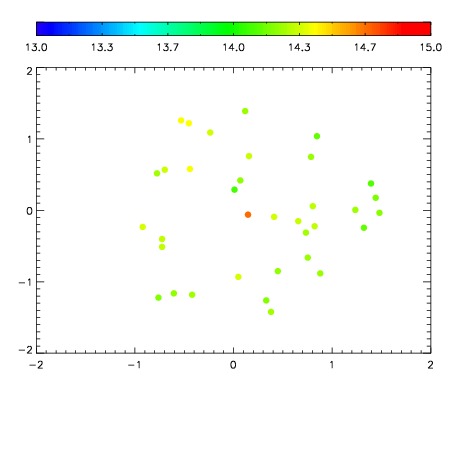
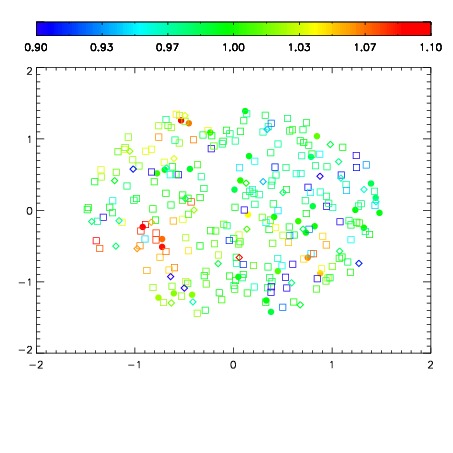
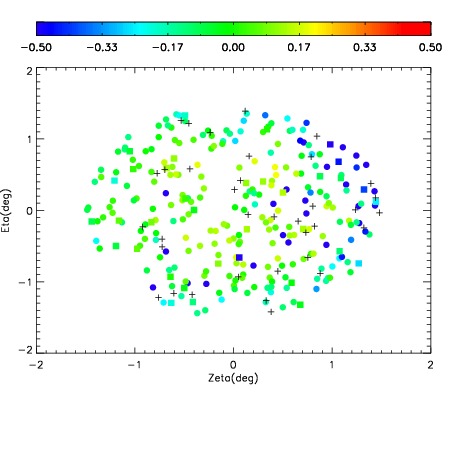
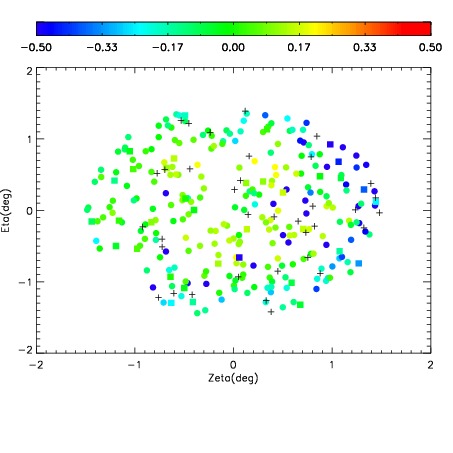
| Spatial sky 16325A emission deviations (filled: sky, open: star)
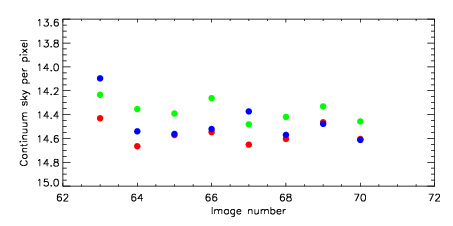
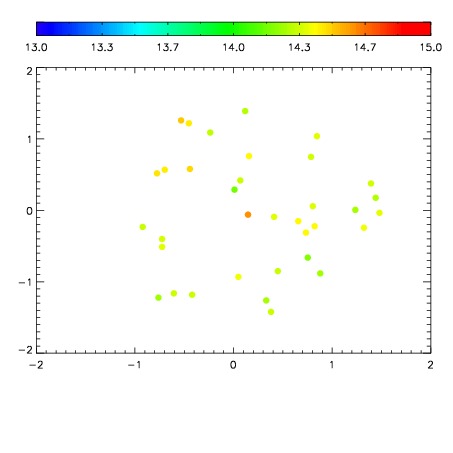
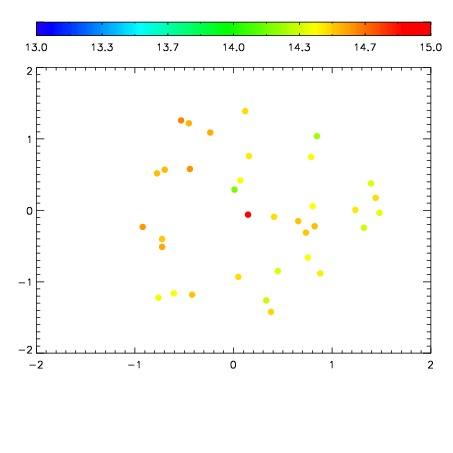
| Spatial sky continuum emission
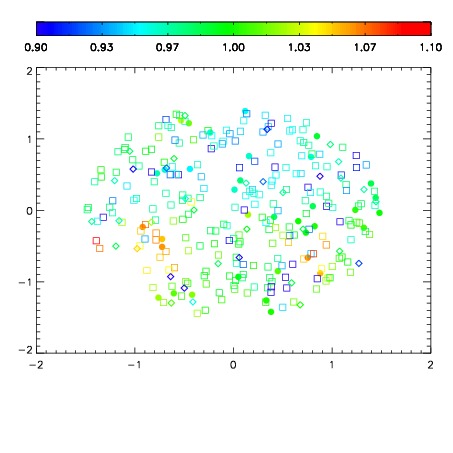
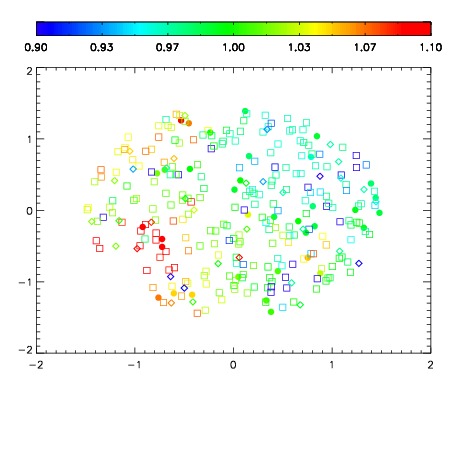
| Spatial sky telluric CO2 absorption deviations (filled: H < 10)
|
| 11400063
| 47
| | Red | Green | Blue
| | z | | 18.44
| | znorm | | 14.26
| | sky | 14.4 | 14.2 | 14.1
| | S/N | 9.6 | 17.2 | 17.3
| | S/N(c) | 8.1 | 15.8 | 16.1
| | SN(E/C) 0.56
|
| 
| 
| 
| 
| 
|
| 11400064
| 47
| | Red | Green | Blue
| | z | | 18.57
| | znorm | | 14.39
| | sky | 14.7 | 14.4 | 14.5
| | S/N | 10.5 | 18.3 | 19.7
| | S/N(c) | 8.9 | 17.0 | 18.1
| | SN(E/C) 0.55
|
| 
| 
| 
| 
| 
|
| 11400065
| 47
| | Red | Green | Blue
| | z | | 18.54
| | znorm | | 14.36
| | sky | 14.6 | 14.4 | 14.6
| | S/N | 10.2 | 18.0 | 19.0
| | S/N(c) | 8.7 | 16.3 | 17.8
| | SN(E/C) 0.57
|
| 
| 
| 
| 
| 
|
| 11400066
| 47
| | Red | Green | Blue
| | z | | 18.49
| | znorm | | 14.31
| | sky | 14.5 | 14.3 | 14.5
| | S/N | 9.9 | 17.6 | 18.6
| | S/N(c) | 8.6 | 16.0 | 17.1
| | SN(E/C) 0.56
|
| 
| 
| 
| 
| 
|
| 11400067
| 47
| | Red | Green | Blue
| | z | | 18.62
| | znorm | | 14.44
| | sky | 14.7 | 14.5 | 14.4
| | S/N | 11.0 | 18.7 | 19.7
| | S/N(c) | 9.4 | 16.9 | 18.4
| | SN(E/C) 0.54
|
| 
| 
| 
| 
| 
|
| 11400068
| 47
| | Red | Green | Blue
| | z | | 18.69
| | znorm | | 14.51
| | sky | 14.6 | 14.4 | 14.6
| | S/N | 11.4 | 19.5 | 20.6
| | S/N(c) | 9.6 | 17.8 | 19.1
| | SN(E/C) 0.53
|
| 
| 
| 
| 
| 
|
| 11400069
| 47
| | Red | Green | Blue
| | z | | 18.67
| | znorm | | 14.49
| | sky | 14.5 | 14.3 | 14.5
| | S/N | 11.4 | 18.8 | 20.4
| | S/N(c) | 9.5 | 17.5 | 19.2
| | SN(E/C) 0.53
|
| 
| 
| 
| 
| 
|
| 11400070
| 47
| | Red | Green | Blue
| | z | | 18.71
| | znorm | | 14.53
| | sky | 14.6 | 14.5 | 14.6
| | S/N | 11.5 | 19.6 | 21.3
| | S/N(c) | 9.8 | 17.8 | 19.8
| | SN(E/C) 0.50
|
| 
| 
| 
| 
| 
|