| Red | Green | Blue | |
| z | 17.64 | ||
| znorm | Inf | ||
| sky | -Inf | -Inf | -Inf |
| S/N | 18.2 | 33.4 | 36.2 |
| S/N(c) | 0.0 | 0.0 | 0.0 |
| SN(E/C) |

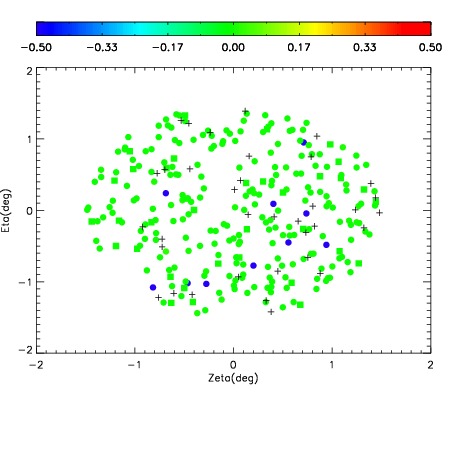
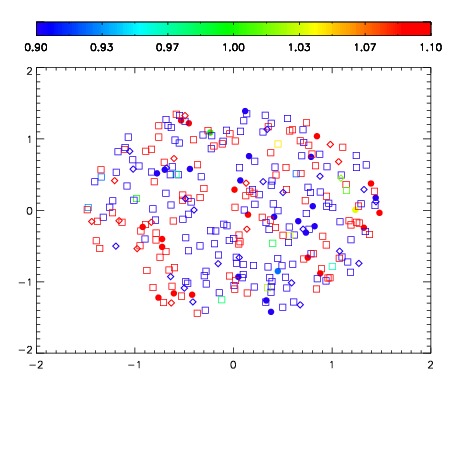
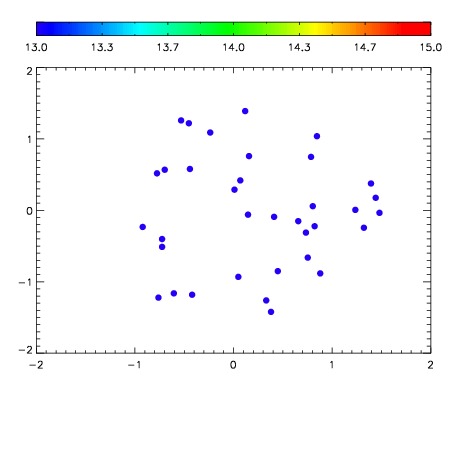

| Frame | Nreads | Zeropoints | Mag plots | Spatial mag deviation | Spatial sky 16325A emission deviations (filled: sky, open: star) | Spatial sky continuum emission | Spatial sky telluric CO2 absorption deviations (filled: H < 10) | |||||||||||||||||||||||
| 0 | 0 |
|
|
|
|
|
|
| IPAIR | NAME | SHIFT | NEWSHIFT | S/N | NAME | SHIFT | NEWSHIFT | S/N |
| 0 | 11400065 | 0.473006 | 0.00000 | 180.411 | 11400063 | 0.00000 | 0.473006 | 177.040 |
| 1 | 11400068 | 0.472402 | 0.000604004 | 189.282 | 11400067 | 0.000986887 | 0.472019 | 187.332 |
| 2 | 11400069 | 0.472967 | 3.90112e-05 | 188.019 | 11400070 | -0.000349175 | 0.473355 | 186.464 |
| 3 | 11400064 | 0.473002 | 4.02331e-06 | 183.832 | 11400066 | -0.000598195 | 0.473604 | 178.119 |