| Red | Green | Blue | |
| z | 17.64 | ||
| znorm | Inf | ||
| sky | -NaN | -Inf | -Inf |
| S/N | 25.6 | 46.4 | 50.4 |
| S/N(c) | 0.0 | 0.0 | 0.0 |
| SN(E/C) |

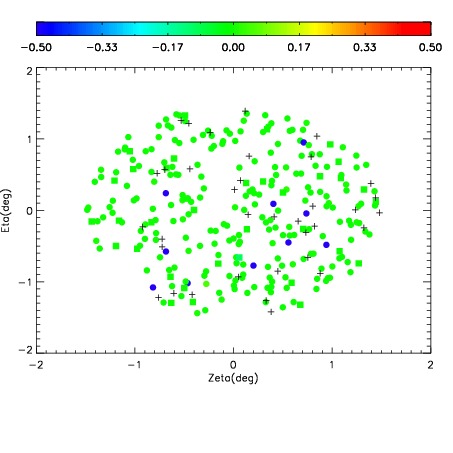
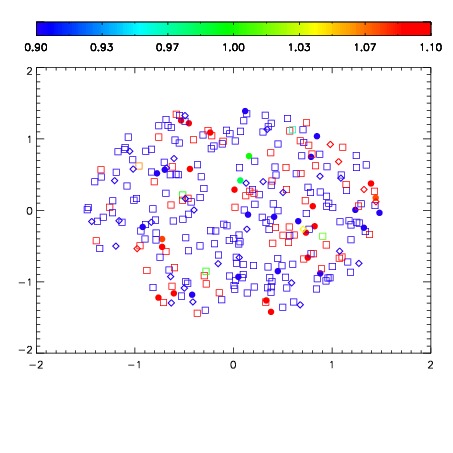
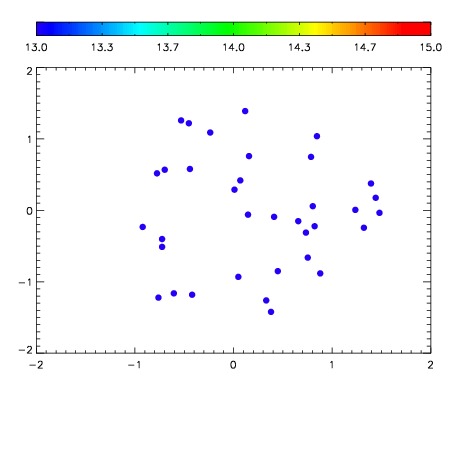

| Frame | Nreads | Zeropoints | Mag plots | Spatial mag deviation | Spatial sky 16325A emission deviations (filled: sky, open: star) | Spatial sky continuum emission | Spatial sky telluric CO2 absorption deviations (filled: H < 10) | |||||||||||||||||||||||
| 0 | 0 |
|
|
|
|
|
|
| IPAIR | NAME | SHIFT | NEWSHIFT | S/N | NAME | SHIFT | NEWSHIFT | S/N |
| 0 | 11470028 | 0.479245 | 0.00000 | 242.751 | 11470025 | -0.00189267 | 0.481138 | 238.679 |
| 1 | 11470027 | 0.478035 | 0.00121000 | 243.000 | 11470022 | 0.00000 | 0.479245 | 240.859 |
| 2 | 11470023 | 0.475182 | 0.00406301 | 241.061 | 11470029 | 0.000400371 | 0.478845 | 237.373 |
| 3 | 11470024 | 0.476237 | 0.00300801 | 240.951 | 11470026 | -0.00199638 | 0.481241 | 234.733 |