| Red | Green | Blue | |
| z | 17.64 | ||
| znorm | Inf | ||
| sky | -Inf | -Inf | -Inf |
| S/N | 28.0 | 49.8 | 54.9 |
| S/N(c) | 0.0 | 0.0 | 0.0 |
| SN(E/C) |
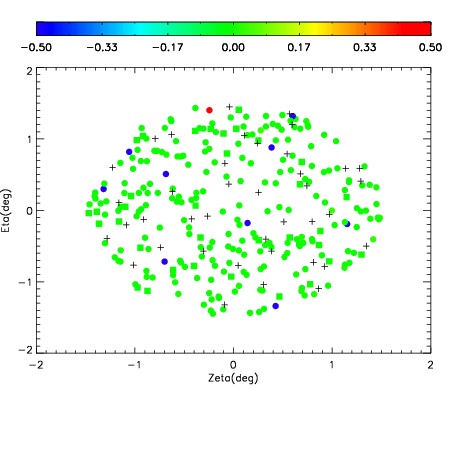
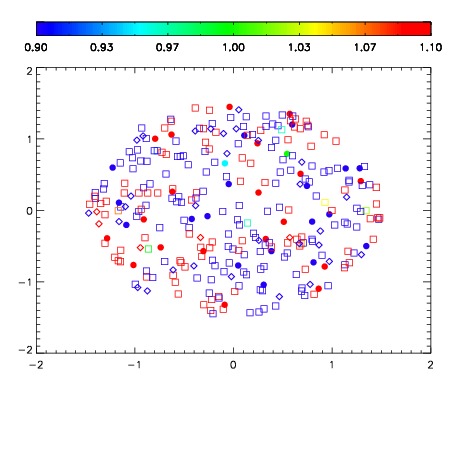
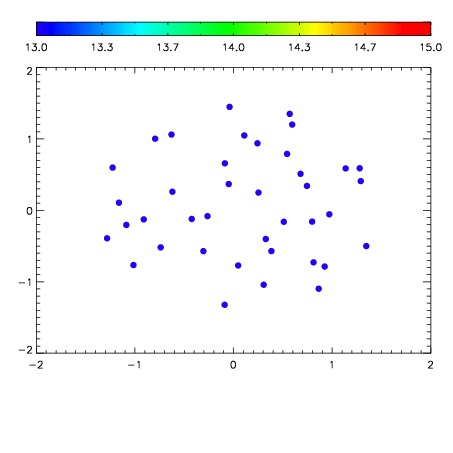

| Frame | Nreads | Zeropoints | Mag plots | Spatial mag deviation | Spatial sky 16325A emission deviations (filled: sky, open: star) | Spatial sky continuum emission | Spatial sky telluric CO2 absorption deviations (filled: H < 10) | |||||||||||||||||||||||
| 0 | 0 |
|
|
|
|
|
|
| IPAIR | NAME | SHIFT | NEWSHIFT | S/N | NAME | SHIFT | NEWSHIFT | S/N |
| 0 | 04870032 | 0.502859 | 0.00000 | 240.576 | 04870033 | 0.00373604 | 0.499123 | 244.081 |
| 1 | 04870028 | 0.497946 | 0.00491300 | 239.089 | 04870029 | 0.000922460 | 0.501937 | 233.772 |
| 2 | 04870031 | 0.501092 | 0.00176698 | 234.464 | 04870030 | 0.00122451 | 0.501634 | 232.165 |
| 3 | 04870027 | 0.498220 | 0.00463900 | 231.418 | 04870026 | 0.00000 | 0.502859 | 228.081 |